10-K: Annual report pursuant to Section 13 and 15(d)
Published on February 28, 2008
Table of Contents
UNITED STATES
SECURITIES AND EXCHANGE COMMISSION
Washington, D.C. 20549
FORM 10-K
| x | ANNUAL REPORT PURSUANT TO SECTION 13 OR 15(d) OF THE SECURITIES EXCHANGE ACT OF 1934 |
For the fiscal year ended December 31, 2007
OR
| ¨ | TRANSITION REPORT PURSUANT TO SECTION 13 OR 15(d) OF THE SECURITIES EXCHANGE ACT OF 1934 |
For the transition period from to
Commission File No. 1-2217

(Exact name of Registrant as specified in its charter)
| DELAWARE | 58-0628465 | |
| (State or other jurisdiction of incorporation or organization) |
(IRS Employer Identification No.) |
|
| One Coca-Cola Plaza Atlanta, Georgia |
30313 | |
| (Address of principal executive offices) | (Zip Code) | |
Registrants telephone number, including area code: (404) 676-2121
Securities registered pursuant to Section 12(b) of the Act:
| Title of each class |
Name of each exchange on which registered |
|
| COMMON STOCK, $0.25 PAR VALUE |
NEW YORK STOCK EXCHANGE |
Securities registered pursuant to Section 12(g) of the Act: None
Indicate by check mark if the Registrant is a well-known seasoned issuer, as defined in Rule 405 of the Securities Act. Yes x No ¨
Indicate by check mark if the Registrant is not required to file reports pursuant to Section 13 or Section 15(d) of the Exchange Act. Yes ¨ No x
Indicate by check mark whether the Registrant (1) has filed all reports required to be filed by Section 13 or 15(d) of the Securities Exchange Act of 1934 during the preceding 12 months and (2) has been subject to such filing requirements for the past 90 days. Yes x No ¨
Indicate by check mark if disclosure of delinquent filers pursuant to Item 405 of Regulation S-K is not contained herein, and will not be contained, to the best of Registrants knowledge, in definitive proxy or information statements incorporated by reference in Part III of this Form 10-K or any amendment to this Form 10-K. ¨
Indicate by check mark whether the registrant is a large accelerated filer, an accelerated filer, a non-accelerated filer, or a smaller reporting company. See the definitions of large accelerated filer, accelerated filer and smaller reporting company in Rule 12b-2 of the Exchange Act. (Check one):
| Large accelerated filer x Accelerated filer ¨ Non-accelerated filer ¨ Smaller reporting company ¨ | ||
| (Do not check if a smaller reporting company) | ||
Indicate by check mark if the Registrant is a shell company (as defined in Rule 12b-2 of the Exchange Act). Yes ¨ No x
The aggregate market value of the common equity held by non-affiliates of the Registrant (assuming for these purposes, but without conceding, that all executive officers and Directors are affiliates of the Registrant) as of June 29, 2007, the last business day of the Registrants most recently completed second fiscal quarter, was $114,819,922,506 (based on the closing sale price of the Registrants Common Stock on that date as reported on the New York Stock Exchange).
The number of shares outstanding of the Registrants Common Stock as of February 22, 2008 was 2,324,012,042.
DOCUMENTS INCORPORATED BY REFERENCE
Portions of the Companys Proxy Statement for the Annual Meeting of Shareowners to be held on April 16, 2008, are incorporated by reference in Part III.
Table of Contents
| Page | ||||
| 1 | ||||
| Item 1. |
1 | |||
| Item 1A. |
12 | |||
| Item 1B. |
19 | |||
| Item 2. |
19 | |||
| Item 3. |
20 | |||
| Item 4. |
24 | |||
| Item X. |
24 | |||
| Item 5. |
28 | |||
| Item 6. |
31 | |||
| Item 7. |
Managements Discussion and Analysis of Financial Condition and Results of Operations |
32 | ||
| Item 7A. |
64 | |||
| Item 8. |
65 | |||
| Item 9. |
Changes in and Disagreements with Accountants on Accounting and Financial Disclosure |
134 | ||
| Item 9A. |
134 | |||
| Item 9B. |
134 | |||
| Item 10. |
135 | |||
| Item 11. |
135 | |||
| Item 12. |
Security Ownership of Certain Beneficial Owners and Management and Related Stockholder Matters |
135 | ||
| Item 13. |
Certain Relationships and Related Transactions, and Director Independence |
135 | ||
| Item 14. |
135 | |||
| Item 15. |
136 | |||
| 144 | ||||
Table of Contents
This report contains information that may constitute forward-looking statements. Generally, the words believe, expect, intend, estimate, anticipate, project, will and similar expressions identify forward-looking statements, which generally are not historical in nature. All statements that address operating performance, events or developments that we expect or anticipate will occur in the futureincluding statements relating to volume growth, share of sales and earnings per share growth, and statements expressing general views about future operating resultsare forward-looking statements. Management believes that these forward-looking statements are reasonable as and when made. However, caution should be taken not to place undue reliance on any such forward-looking statements because such statements speak only as of the date when made. Our Company undertakes no obligation to publicly update or revise any forward-looking statements, whether as a result of new information, future events or otherwise, except as required by law. In addition, forward-looking statements are subject to certain risks and uncertainties that could cause actual results to differ materially from our Companys historical experience and our present expectations or projections. These risks and uncertainties include, but are not limited to, those described in Part I, Item 1A. Risk Factors and elsewhere in this report and those described from time to time in our future reports filed with the Securities and Exchange Commission.
General
The Coca-Cola Company is the largest manufacturer, distributor and marketer of nonalcoholic beverage concentrates and syrups in the world. Finished beverage products bearing our trademarks, sold in the United States since 1886, are now sold in more than 200 countries. Along with Coca-Cola, which is recognized as the worlds most valuable brand, we market four of the worlds top five nonalcoholic sparkling brands, including Diet Coke, Fanta and Sprite. In this report, the terms Company, we, us or our mean The Coca-Cola Company and all entities included in our consolidated financial statements.
Our business is nonalcoholic beveragesprincipally sparkling beverages, but also a variety of still beverages. We manufacture beverage concentrates and syrups, which we sell to bottling and canning operations, fountain wholesalers and some fountain retailers, as well as finished beverages, which we sell primarily to distributors. Our Company owns or licenses more than 450 brands, including diet and light beverages, waters, enhanced waters, juices and juice drinks, teas, coffees, and energy and sports drinks. In addition, we have ownership interests in numerous beverage joint ventures, bottling and canning operations, although most of these operations are independently owned and managed.
We were incorporated in September 1919 under the laws of the State of Delaware and succeeded to the business of a Georgia corporation with the same name that had been organized in 1892.
Our Company is one of numerous competitors in the commercial beverages market. Of the approximately 53 billion beverage servings of all types consumed worldwide every day, beverages bearing trademarks owned by or licensed to us account for approximately 1.5 billion.
We believe that our success depends on our ability to connect with consumers by providing them with a wide variety of choices to meet their desires, needs and lifestyle choices. Our success further depends on the ability of our people to execute effectively, every day.
Our goal is to use our Companys assetsour brands, financial strength, unrivaled distribution system, global reach and the talent and strong commitment of our management and associatesto become more competitive and to accelerate growth in a manner that creates value for our shareowners.
1
Table of Contents
Operating Segments
The Companys operating structure is the basis for our internal financial reporting. As of December 31, 2007, our operating structure included the following operating segments, the first seven of which are sometimes referred to as operating groups or groups:
| | Africa |
| | Eurasia |
| | European Union |
| | Latin America |
| | North America |
| | Pacific |
| | Bottling Investments |
| | Corporate |
Our operating structure as of December 31, 2007 reflected changes we made effective January 1, 2007, when we combined the Eurasia and Middle East Division, and the Russia, Ukraine and Belarus Division, both of which previously had been included in the former North Asia, Eurasia and Middle East operating segment, with the India Division, which previously had been included in the former East, South Asia and Pacific Rim operating segment, to form the Eurasia operating segment; and combined the China Division and the Japan Division, both of which previously had been included in the former North Asia, Eurasia and Middle East operating segment, with the remaining former East, South Asia and Pacific Rim operating segment to form the Pacific operating segment. We revised previously reported operating segment information to conform to our current operating structure.
Except to the extent that differences among operating segments are material to an understanding of our business taken as a whole, the description of our business in this report is presented on a consolidated basis.
For financial information about our operating segments and geographic areas, refer to Note 6 and Note 21 of Notes to Consolidated Financial Statements set forth in Part II, Item 8. Financial Statements and Supplementary Data of this report, incorporated herein by reference. For certain risks attendant to our non-U.S. operations, refer to Item 1A. Risk Factors, below.
Products and Distribution
Our Company manufactures and sells beverage concentrates, sometimes referred to as beverage bases, and syrups, including fountain syrups, and finished beverages.
As used in this report:
| | concentrates means flavoring ingredients and, depending on the product, sweeteners used to prepare syrups or finished beverages; |
| | syrups means the beverage ingredients produced by combining concentrates and, depending on the product, sweeteners and added water; |
| | fountain syrups means syrups that are sold to fountain retailers, such as restaurants, that use dispensing equipment to mix the syrups with sparkling or still water at the time of purchase to produce finished beverages that are served in cups or glasses for immediate consumption; |
| | sparkling beverages means nonalcoholic ready-to-drink beverages with carbonation, including energy drinks and carbonated waters and flavored waters; |
2
Table of Contents
| | still beverages means nonalcoholic beverages without carbonation, including non-carbonated waters, flavored waters and enhanced waters, juices and juice drinks, teas, coffees and sports drinks; and |
| | Company Trademark Beverages means beverages bearing our trademarks and certain other beverage products licensed to us for which we provide marketing support and from the sale of which we derive economic benefit. |
We sell the concentrates and syrups for bottled and canned beverages to authorized bottling and canning operations. In addition to concentrates and syrups for sparkling beverages and flavored still beverages, we also sell concentrates (in powder form) for purified water products such as Dasani to authorized bottling operations.
Authorized bottlers and canners either combine our syrups with sparkling water or combine our concentrates with sweeteners (depending on the product), still water and/or sparkling water to produce finished sparkling beverages. The finished sparkling beverages are packaged in authorized containers bearing our trademarkssuch as cans and refillable and nonrefillable glass and plastic bottles (bottle/can products)and are then sold to retailers (bottle/can retailers) or, in some cases, wholesalers.
For our fountain products in the United States, we manufacture fountain syrups and sell them to authorized fountain wholesalers and some fountain retailers. The wholesalers are authorized to sell the Companys fountain syrups by a nonexclusive appointment from us that neither restricts us in setting the prices at which we sell fountain syrups to the wholesalers, nor restricts the territory in which the wholesalers may resell in the United States. Outside the United States, fountain syrups typically are manufactured by authorized bottlers from concentrates sold to them by the Company. The bottlers then typically sell the fountain syrups to wholesalers or directly to fountain retailers.
Finished beverages manufactured by us include a variety of sparkling and still beverages. We sell these beverages to authorized bottlers or distributors, wholesalers or directly to retailers. We manufacture and sell juice and juice-drink products and certain water products to retailers and wholesalers in the United States and numerous other countries, both directly and through a network of business partners, including certain Coca-Cola bottlers.
Our beverage products include Coca-Cola, Coca-Cola Classic, caffeine free Coca-Cola, caffeine free Coca-Cola Classic, Cherry Coke, Diet Coke (sold under the trademark Coca-Cola Light in many countries other than the United States), caffeine free Diet Coke, Diet Coke Sweetened with Splenda, Diet Coke with Lime, Diet Cherry Coke, Diet Coke Plus, Coca-Cola Zero (sold under the trademark Coke Zero in some countries), Fanta brand sparkling beverages, Sprite, Diet Sprite/Sprite Zero (sold under the trademark Sprite Light in many countries other than the United States), Pibb Xtra, Mello Yello, Tab, Fresca brand sparkling beverages, Barqs, Powerade, Aquarius, Sokenbicha, Ciel, Bonaqa/Bonaqua, Dasani, Dasani brand flavored waters, Georgia brand ready-to-drink coffees (sold in Japan), Lift, Thums Up, Kinley, Eight OClock, Qoo, Vault, Full Throttle and other products developed for specific countries. In many countries (excluding the United States, among others), our Companys beverage products also include Schweppes, Canada Dry, Dr Pepper and Crush. Our Company produces, distributes and markets juice and juice-drink products, including Minute Maid juices and juice drinks, Simply juices and juice drinks, Odwalla nourishing health beverages, Five Alive refreshment beverages, Bacardi mixers concentrate (manufactured and marketed under license agreements from Bacardi & Company Limited) and Hi-C ready-to-serve juice drinks. We have a license to manufacture and sell concentrates for Seagrams mixers, a line of sparkling drinks, in the United States and certain other countries. Our Company has an exclusive master distribution agreement for Evian bottled water in the United States and Canada, and for Rockstar, an energy drink, in most of the United States and in Canada. In addition, in the United States we market Nestea and Enviga products under a sublicense agreement with Nestlé USA, Inc. Multon, a Russian juice business (Multon) operated as a joint venture with Coca-Cola Hellenic Bottling Company S.A., markets juice products under various trademarks, including Dobriy, Rich and Nico, in Russia, Ukraine and Belarus. Beverage Partners Worldwide (BPW), the Companys joint venture with Nestlé S.A. (Nestlé), markets ready-to-drink tea products under various trademarks, including Yang Guang, Nagomi, Frestea, Ten Ren and Shi-Zen, in various markets worldwide, other than the United States and Japan.
3
Table of Contents
Consumer demand determines the optimal menu of Company product offerings. Consumer demand can vary from one locale to another and can change over time within a single locale. Employing our business strategy, and with special focus on core brands, our Company seeks to build its existing brands and, at the same time, to broaden its historical family of brands, products and services in order to create and satisfy consumer demand locale by locale.
During 2007, we expanded our still beverage offerings by acquiring Energy Brands Inc., also known as glacéau, the maker of enhanced water brands such as vitaminwater, fruitwater and smartwater, and vitaminenergy; Fuze Beverage, LLC (Fuze), the maker of the Fuze fortified beverages, enhanced water, tea-flavored beverages, and sports and fruit drinks; and Leao Junior, S.A. (Leao Junior), a Brazilian herbal beverage company. Also during 2007, we and Coca-Cola FEMSA, S.A.B. de C.V. jointly acquired Jugos del Valle, S.A.B. de C.V. (Jugos del Valle), the second largest producer of packaged juices, nectars and fruit-flavored beverages in Mexico and the largest producer of such beverages in Brazil. In addition, during 2007, our Company introduced a variety of new brands, brand extensions and new beverage products. Among numerous examples, in the United States, the Company launched Dasani Plus enhanced water beverages, Vanilla Coke Zero and the Minute Maid Enhanced Juice line; and in Canada, we launched the Fanta brand of sparkling beverages. In Latin America, the products launched included Coca-Cola Zero, Fanta Zero, Lift Zero, Fresca Zero, Lift + Manzana, Fresca Lado B, Dasani and Flanm. In Europe, new launches included Diet Coke Plus in Great Britain, Coke Zero in Austria and Switzerland, Coca-Cola Blak in the Czech Republic and Slovakia, and Fruitopia by Minute Maid in Germany. We also launched Damla, a spring water, in Turkey; Coke Zero in Croatia and Romania; and Next Joy in Serbia. In the Middle East, we launched Burn, Cappy juice, and Jericho and Sahtain waters. In Pakistan, we launched Sprite 3G and in Kazakhstan, Cappy juice. Also, in Japan we launched Ayataka, a premium ready-to-drink green tea.
Our Company measures the volume of products sold in two ways: (1) unit cases of finished products and (2) concentrate sales. As used in this report, unit case means a unit of measurement equal to 192 U.S. fluid ounces of finished beverage (24 eight-ounce servings); and unit case volume means the number of unit cases (or unit case equivalents) of Company beverage products directly or indirectly sold by the Company and its bottling partners (Coca-Cola system) to customers. Unit case volume primarily consists of beverage products bearing Company trademarks. Also included in unit case volume are certain products licensed to, or distributed by, our Company, and brands owned by Coca-Cola system bottlers for which our Company provides marketing support and from the sale of which we derive economic benefit. Such products licensed to, or distributed by, our Company or owned by Coca-Cola system bottlers account for a minimal portion of total unit case volume. In addition, unit case volume includes sales by joint ventures in which the Company has an equity interest. Although most of our Companys revenues are not based directly on unit case volume, we believe unit case volume is one of the measures of the underlying strength of the Coca-Cola system because it measures trends at the consumer level. The unit case volume numbers used in this report are based on estimates received by the Company from its bottling partners and distributors. Concentrate sales volume represents the amount of concentrates, syrups, beverage bases and powders (in all cases expressed in equivalent unit cases) sold by, or used in finished beverages sold by, the Company to its bottling partners or other customers. Concentrate sales replaced the gallon sales concept beginning with the first quarter of 2007. We made this change primarily to replace equivalent gallons with equivalent unit cases as a unit of measurement for concentrates, syrups, beverage bases and powders, which better reflects how our Company conducts its operations. Most of our revenues are based on concentrate sales, a primarily wholesale activity. Unit case volume and concentrate sales growth rates are not necessarily equal during any given period. Items such as seasonality, bottlers inventory practices, supply point changes, timing of price increases, new product introductions and changes in product mix can impact unit case volume and concentrate sales and can create differences between unit case volume and concentrate sales growth rates.
In 2007, concentrates and syrups for beverages bearing the trademark Coca-Cola or any trademark that includes Coca-Cola or Coke (Coca-Cola Trademark Beverages) accounted for approximately 53 percent of the Companys total concentrate sales.
In 2007, concentrate sales in the United States (U.S. concentrate sales) represented approximately 24 percent of the Companys worldwide concentrate sales. Approximately 56 percent of U.S. concentrate sales for 2007 was
4
Table of Contents
attributable to sales of beverage concentrates and syrups to 76 authorized bottler ownership groups in 393 licensed territories. Those bottlers prepare and sell finished beverages bearing our trademarks for the food store and vending machine distribution channels and for other distribution channels supplying products for home and immediate consumption. Approximately 33 percent of 2007 U.S. concentrate sales was attributable to fountain syrups sold to fountain retailers and to 491 authorized fountain wholesalers, some of which are authorized bottlers. The remaining approximately 11 percent of 2007 U.S. concentrate sales was attributable to sales by the Company of finished beverages, including juice and juice-drink products and certain water products. Coca-Cola Enterprises Inc., including its bottling subsidiaries and divisions (CCE), accounted for approximately 48 percent of the Companys U.S. concentrate sales in 2007. At December 31, 2007, our Company held an ownership interest of approximately 35 percent in CCE, which is the worlds largest bottler of Company Trademark Beverages.
In 2007, concentrate sales outside the United States represented approximately 76 percent of the Companys worldwide concentrate sales. The countries outside the United States in which our concentrate sales were the largest in 2007 were Mexico, Brazil, China and Japan, which together accounted for approximately 28 percent of our worldwide concentrate sales. Approximately 90 percent of non-U.S. unit case volume for 2007 was attributable to sales of beverage concentrates and syrups to authorized bottlers together with sales by the Company of finished beverages, other than juice and juice-drink products, in 490 licensed territories. Approximately 5 percent of 2007 non-U.S. unit case volume was attributable to fountain syrups. The remaining approximately 5 percent of 2007 non-U.S. unit case volume was attributable to juice and juice-drink products.
In addition to conducting our own independent advertising and marketing activities, we may provide promotional and marketing services or funds to our bottlers. In most cases, we do this on a discretionary basis under the terms of commitment letters or agreements, even though we are not obligated to do so under the terms of the bottling or distribution agreements between our Company and the bottlers. Also, on a discretionary basis in most cases, our Company may develop and introduce new products, packages and equipment to assist its bottlers. Likewise, in many instances, we provide promotional and marketing services and/or funds and/or dispensing equipment and repair services to fountain and bottle/can retailers, typically pursuant to marketing agreements. The aggregate amount of funds provided by our Company to bottlers, resellers or other customers of our Companys products, principally for participation in promotional and marketing programs, was approximately $4.1 billion in 2007.
Bottlers Agreements and Distribution Agreements
Most of our products are manufactured and sold by our bottling partners. We typically sell concentrates and syrups to our bottling partners, who convert them into finished packaged products which they sell to distributors and other customers. Separate contracts (Bottlers Agreements) exist between our Company and each of our bottling partners regarding the manufacture and sale of Company products. Subject to specified terms and conditions and certain variations, the Bottlers Agreements generally authorize the bottlers to prepare specified Company Trademark Beverages, to package the same in authorized containers, and to distribute and sell the same in (but, subject to applicable local law, generally only in) an identified territory. The bottler is obligated to purchase its entire requirement of concentrates or syrups for the designated Company Trademark Beverages from the Company or Company-authorized suppliers. We typically agree to refrain from selling or distributing, or from authorizing third parties to sell or distribute, the designated Company Trademark Beverages throughout the identified territory in the particular authorized containers; however, we typically reserve for ourselves or our designee the right (1) to prepare and package such beverages in such containers in the territory for sale outside the territory, and (2) to prepare, package, distribute and sell such beverages in the territory, in any other manner or form. Territorial restrictions on bottlers vary in some cases in accordance with local law.
Being a bottler does not create a legal partnership or joint venture between us and our bottlers. Our bottlers are independent contractors and are not our agents.
The Bottlers Agreements between us and our authorized bottlers in the United States differ in certain respects from those in the other countries in which Company Trademark Beverages are sold. As further discussed below, the
5
Table of Contents
principal differences involve the duration of the agreements; the inclusion or exclusion of canned beverage production rights; the inclusion or exclusion of authorizations to manufacture and distribute fountain syrups; in some cases, the degree of flexibility on the part of the Company to determine the pricing of syrups and concentrates; and the extent, if any, of the Companys obligation to provide marketing support.
Outside the United States
The Bottlers Agreements between us and our authorized bottlers outside the United States generally are of stated duration, subject in some cases to possible extensions or renewals of the term of the contract. Generally, these contracts are subject to termination by the Company following the occurrence of certain designated events. These events include defined events of default and certain changes in ownership or control of the bottler.
In certain parts of the world outside the United States, we have not granted comprehensive beverage production rights to the bottlers. In such instances, we or our authorized suppliers sell Company Trademark Beverages to the bottlers for sale and distribution throughout the designated territory, often on a nonexclusive basis. A majority of the Bottlers Agreements in force between us and bottlers outside the United States authorize the bottlers to manufacture and distribute fountain syrups, usually on a nonexclusive basis.
Our Company generally has complete flexibility to determine the price and other terms of sale of the concentrates and syrups we sell to bottlers outside the United States. In some instances, however, we have agreed or may in the future agree with the bottler with respect to concentrate pricing on a prospective basis for specified time periods. Outside the United States, in most cases, we have no obligation to provide marketing support to the bottlers. Nevertheless, we may, at our discretion, contribute toward bottler expenditures for advertising and marketing. We may also elect to undertake independent or cooperative advertising and marketing activities.
Within the United States
In the United States, with certain very limited exceptions, the Bottlers Agreements for Coca-Cola Trademark Beverages and other cola-flavored beverages have no stated expiration date. Our standard contracts for other sparkling beverage flavors and for still beverages are of stated duration, subject to bottler renewal rights. The Bottlers Agreements in the United States are subject to termination by the Company for nonperformance or upon the occurrence of certain defined events of default that may vary from contract to contract. The 1987 Contract, described below, is terminable by the Company upon the occurrence of certain events, including:
| | the bottlers insolvency, dissolution, receivership or the like; |
| | any disposition by the bottler or any of its subsidiaries of any voting securities of any bottler subsidiary without the consent of the Company; |
| | any material breach of any obligation of the bottler under the 1987 Contract; or |
| | except in the case of certain bottlers, if a person or affiliated group acquires or obtains any right to acquire beneficial ownership of more than 10 percent of any class or series of voting securities of the bottler without authorization by the Company. |
Under the terms of the Bottlers Agreements, bottlers in the United States are authorized to manufacture and distribute Company Trademark Beverages in bottles and cans. However, these bottlers generally are not authorized to manufacture fountain syrups. Rather, as described above, our Company manufactures and sells fountain syrups to authorized fountain wholesalers (including certain authorized bottlers) and some fountain retailers. These wholesalers in turn sell the syrups or deliver them on our behalf to restaurants and other retailers.
In the United States, the form of Bottlers Agreement for cola-flavored sparkling beverages that covers the largest amount of U.S. concentrate sales (the 1987 Contract) gives us complete flexibility to determine the price and other
6
Table of Contents
terms of sale of concentrates and syrups for Company Trademark Beverages. In some instances, we have agreed or may in the future agree with the bottler with respect to concentrate pricing on a prospective basis for specified time periods. Bottlers operating under the 1987 Contract accounted for approximately 91.8 percent of our Companys total U.S. concentrate sales for bottled and canned beverages in 2007, excluding direct sales by the Company of juice and juice-drink products and other finished beverages (U.S. bottle/can concentrate sales). Certain other forms of U.S. Bottlers Agreements, entered into prior to 1987, provide for concentrates or syrups for certain Coca-Cola Trademark Beverages and other cola-flavored Company Trademark Beverages to be priced pursuant to a stated formula. Bottlers accounting for approximately 7.8 percent of U.S. bottle/can concentrate sales in 2007 have contracts for certain Coca-Cola Trademark Beverages and other cola-flavored Company Trademark Beverages with pricing formulas that generally provide for a baseline price. This baseline price may be adjusted periodically by the Company, up to a maximum indexed ceiling price, and is adjusted quarterly based upon changes in certain sugar or sweetener prices, as applicable. Bottlers accounting for the remaining approximately 0.4 percent of U.S. bottle/can concentrate sales in 2007 operate under our oldest form of contract, which provides for a fixed price for Coca-Cola syrup used in bottles and cans. This price is subject to quarterly adjustments to reflect changes in the quoted price of sugar.
We have standard contracts with bottlers in the United States for the sale of concentrates and syrups for non-cola-flavored sparkling beverages and certain still beverages in bottles and cans, and, in certain cases, for the sale of finished still beverages in bottles and cans. All of these standard contracts give the Company complete flexibility to determine the price and other terms of sale.
Under the 1987 Contract and most of our other standard beverage contracts with bottlers in the United States, our Company has no obligation to participate with bottlers in expenditures for advertising and marketing. Nevertheless, at our discretion, we may contribute toward such expenditures and undertake independent or cooperative advertising and marketing activities. Some U.S. Bottlers Agreements that predate the 1987 Contract impose certain marketing obligations on us with respect to certain Company Trademark Beverages.
As a practical matter, our Companys ability to exercise its contractual flexibility to determine the price and other terms of sale of its syrups, concentrates and finished beverages under various agreements described above is subject, both outside and within the United States, to competitive market conditions.
Significant Equity Method Investments and Company Bottling Operations
Our Company maintains business relationships with three types of bottlers:
| | bottlers in which the Company has no ownership interest; |
| | bottlers in which the Company has invested and has a noncontrolling ownership interest; and |
| | bottlers in which the Company has invested and has a controlling ownership interest. |
In 2007, bottling operations in which we had no ownership interest produced and distributed approximately 25 percent of our worldwide unit case volume. We have equity positions in 46 unconsolidated bottling, canning and distribution operations for our products worldwide. These cost or equity method investees produced and distributed approximately 54 percent of our worldwide unit case volume in 2007. Controlled and consolidated bottling operations produced and distributed approximately 10 percent of our worldwide unit case volume in 2007. The remaining approximately 11 percent of our worldwide unit case volume in 2007 was produced by our fountain operations and our juice and juice drink, sports drink and other finished beverage operations.
We make equity investments in selected bottling operations with the intention of maximizing the strength and efficiency of the Coca-Cola systems production, distribution and marketing capabilities around the world. These investments are intended to result in increases in unit case volume, net revenues and profits at the bottler level, which in turn generate increased concentrate sales for our Companys concentrate and syrup business. When this occurs, both
7
Table of Contents
we and our bottling partners benefit from long-term growth in volume, improved cash flows and increased shareowner value.
The level of our investment generally depends on the bottlers capital structure and its available resources at the time of the investment. Historically, in certain situations, we have viewed it as advantageous to acquire a controlling interest in a bottling operation, often on a temporary basis. Owning such a controlling interest has allowed us to compensate for limited local resources and has enabled us to help focus the bottlers sales and marketing programs and assist in the development of the bottlers business and information systems and the establishment of appropriate capital structures.
In line with our long-term bottling strategy, we may periodically consider options for reducing our ownership interest in a bottler. One such option is to combine our bottling interests with the bottling interests of others to form strategic business alliances. Another option is to sell our interest in a bottling operation to one of our equity method investee bottlers. In both of these situations, our Company continues to participate in the bottlers results of operations through our share of the strategic business alliances or equity method investees earnings or losses.
In cases where our investments in bottlers represent noncontrolling interests, our intention is to provide expertise and resources to strengthen those businesses.
Significant investees in which we have noncontrolling ownership interests include the following:
Coca-Cola Enterprises Inc. (CCE). Our ownership interest in CCE was approximately 35 percent at December 31, 2007. CCE is the worlds largest bottler of the Companys beverage products. In 2007, sales of concentrates, syrups, mineral waters, juices, sweeteners and finished products by the Company to CCE were approximately $6.3 billion. CCE estimates that the territories in which it markets beverage products to retailers (which include portions of 46 states and the District of Columbia in the United States, the U.S. Virgin Islands and certain other Caribbean islands, Canada, Great Britain, continental France, the Netherlands, Luxembourg, Belgium and Monaco) contain approximately 79 percent of the United States population, 98 percent of the population of Canada, and 100 percent of the populations of Great Britain, continental France, the Netherlands, Luxembourg, Belgium and Monaco. In 2007, CCEs net operating revenues were approximately $20.9 billion. Excluding fountain products, in 2007, approximately 60 percent of the unit case volume of CCE consisted of Coca-Cola Trademark Beverages, approximately 33 percent of its unit case volume consisted of other Company Trademark Beverages and approximately 7 percent of its unit case volume consisted of beverage products of other companies.
Coca-Cola Hellenic Bottling Company S.A. (Coca-Cola Hellenic). At December 31, 2007, our ownership interest in Coca-Cola Hellenic was approximately 23 percent. Coca-Cola Hellenic has bottling and distribution rights, through direct ownership or joint ventures, in Armenia, Austria, Belarus, Bosnia-Herzegovina, Bulgaria, Croatia, Cyprus, the Czech Republic, Estonia, Former Yugoslavian Republic of Macedonia, Greece, Hungary, Italy, Latvia, Lithuania, Moldova, Nigeria, Northern Ireland, Poland, Republic of Ireland, Romania, Russia, Serbia, Montenegro, Slovakia, Slovenia, Switzerland and Ukraine. Coca-Cola Hellenic estimates that the territories in which it markets beverage products contain approximately 67 percent of the population of Italy and 100 percent of the populations of the other countries named above in which Coca-Cola Hellenic has bottling and distribution rights. In 2007, Coca-Cola Hellenics net sales of beverage products were approximately $8 billion. In 2007, approximately 43 percent of the unit case volume of Coca-Cola Hellenic consisted of Coca-Cola Trademark Beverages, approximately 51 percent of its unit case volume consisted of other Company Trademark Beverages and approximately 6 percent of its unit case volume consisted of beverage products of Coca-Cola Hellenic or other companies.
Coca-Cola FEMSA, S.A.B. de C.V. (Coca-Cola FEMSA). Our ownership interest in Coca-Cola FEMSA was approximately 32 percent at December 31, 2007. Coca-Cola FEMSA is a Mexican holding company with bottling subsidiaries in a substantial part of central Mexico, including Mexico City and southeastern Mexico; greater São Paulo, Campinas, Santos, the state of Matto Grosso do Sul and part of the state of Goias in Brazil; central Guatemala; most of
8
Table of Contents
Colombia; all of Costa Rica, Nicaragua, Panama and Venezuela; and greater Buenos Aires, Argentina. Coca-Cola FEMSA estimates that the territories in which it markets beverage products contain approximately 48 percent of the population of Mexico, 16 percent of the population of Brazil, 98 percent of the population of Colombia, 47 percent of the population of Guatemala, 100 percent of the populations of Costa Rica, Nicaragua, Panama and Venezuela, and 31 percent of the population of Argentina. In 2007, Coca-Cola FEMSAs net sales of beverage products were approximately $6 billion. In 2007, approximately 63 percent of the unit case volume of Coca-Cola FEMSA consisted of Coca-Cola Trademark Beverages, approximately 33 percent of its unit case volume consisted of other Company Trademark Beverages and approximately 4 percent of its unit case volume consisted of beverage products of Coca-Cola FEMSA or other companies.
Coca-Cola Amatil Limited (Coca-Cola Amatil). At December 31, 2007, our Companys ownership interest in Coca-Cola Amatil was approximately 30 percent. Coca-Cola Amatil has bottling and distribution rights, through direct ownership or joint ventures, in Australia, New Zealand, Fiji, Papua New Guinea and Indonesia. Coca-Cola Amatil estimates that the territories in which it markets beverage products contain 100 percent of the populations of Australia, New Zealand, Fiji and Papua New Guinea, and 98 percent of the population of Indonesia. In 2007, Coca-Cola Amatils net sales of beverage products from continuing operations were approximately $2.9 billion. In 2007, approximately 49 percent of the unit case volume of Coca-Cola Amatil consisted of Coca-Cola Trademark Beverages, approximately 38 percent of its unit case volume consisted of other Company Trademark Beverages and approximately 13 percent of its unit case volume consisted of beverage products of Coca-Cola Amatil.
Other Interests. BPW, our joint venture with Nestlé, is focused on the total ready-to-drink tea category worldwide, except in the United States and Japan. Multon, a Russian juice business operated as a joint venture with Coca-Cola Hellenic, markets and sells juice products in Russia, Ukraine and Belarus. Jugos del Valle, a beverage business we acquired jointly with Coca-Cola FEMSA in the fourth quarter of 2007, markets and sells packaged juices, nectars and fruit-flavored beverages in Mexico and Brazil.
Seasonality
Sales of our ready-to-drink nonalcoholic beverages are somewhat seasonal, with the second and third calendar quarters accounting for the highest sales volumes. The volume of sales in the beverages business may be affected by weather conditions.
Competition
Our Company competes in the nonalcoholic beverages segment of the commercial beverages industry. Based on internally available data and a variety of industry sources, we believe that in 2007, worldwide sales of Company products accounted for approximately 10 percent of total worldwide sales of nonalcoholic beverage products. The nonalcoholic beverages segment of the commercial beverages industry is highly competitive, consisting of numerous firms. These include firms that, like our Company, compete in multiple geographic areas as well as firms that are primarily regional or local in operation. Competitive products include numerous nonalcoholic sparkling beverages; various water products, including packaged, flavored and enhanced waters; juices and nectars; fruit drinks and dilutables (including syrups and powdered drinks); coffees and teas; energy and sports and other performance-enhancing drinks; dairy-based drinks, and various other nonalcoholic beverages. These competitive beverages are sold to consumers in both ready-to-drink and other than ready-to-drink form. In many of the countries in which we do business, including the United States, PepsiCo, Inc. is one of our primary competitors. Other significant competitors include, but are not limited to, Nestlé, Cadbury Schweppes plc, Groupe Danone, Kraft Foods Inc. and Unilever. We also compete against numerous regional and local firms in various geographic areas in which we operate.
Competitive factors impacting our business include, but are not limited to, pricing, advertising, sales promotion programs, product innovation, increased efficiency in production techniques, the introduction of new packaging, new vending and dispensing equipment, and brand and trademark development and protection.
9
Table of Contents
Our competitive strengths include leading brands with a high level of consumer acceptance; a worldwide network of bottlers and distributors of Company products; sophisticated marketing capabilities; and a talented group of dedicated associates. Our competitive challenges include strong competition in all geographic regions and, in many countries, a concentrated retail sector with powerful buyers able to freely choose among Company products, products of competitive beverage suppliers and individual retailers own store-brand beverages.
Raw Materials
The principal raw materials used by our business are nutritive and non-nutritive sweeteners. In the United States, the principal nutritive sweetener is high fructose corn syrup, a form of sugar, which is available from numerous domestic sources and is historically subject to fluctuations in its market price. The principal nutritive sweetener used by our business outside the United States is sucrose, another form of sugar, which is also available from numerous sources and is historically subject to fluctuations in its market price. Our Company generally has not experienced any difficulties in obtaining its requirements for nutritive sweeteners. In the United States, we purchase high fructose corn syrup to meet our and our bottlers requirements with the assistance of Coca-Cola Bottlers Sales & Services Company LLC (CCBSS). CCBSS is a limited liability company that is owned by authorized Coca-Cola bottlers doing business in the United States. Among other things, CCBSS provides procurement services to our Company for the purchase of various goods and services in the United States, including high fructose corn syrup.
The principal non-nutritive sweeteners we use in our business are aspartame, acesulfame potassium, saccharin, cyclamate and sucralose. Generally, these raw materials are readily available from numerous sources. However, our Company purchases aspartame, an important non-nutritive sweetener that is used alone or in combination with other important non-nutritive sweeteners such as saccharin or acesulfame potassium in our low-calorie sparkling beverage products, primarily from The NutraSweet Company and Ajinomoto Co., Inc., which we consider to be our primary sources for the supply of this product. We currently purchase acesulfame potassium from Nutrinova Nutrition Specialties & Food Ingredients GmbH, which we consider to be our primary source for the supply of this product. Our Company generally has not experienced any difficulties in obtaining its requirements for non-nutritive sweeteners.
Our Company sells a number of products sweetened with sucralose, a non-nutritive sweetener. We work closely with Tate & Lyle, our sucralose supplier, to maintain continuity of supply. Although Tate & Lyle is our single source for sucralose, we do not anticipate difficulties in obtaining our requirements for sucralose.
With regard to juice and juice-drink products, citrus fruit, particularly orange juice concentrate, is our principal raw material. The citrus industry is subject to the variability of weather conditions. In particular, freezing weather or hurricanes in central Florida may result in shortages and higher prices for orange juice concentrate throughout the industry. Due to our ability to also source orange juice concentrate from the Southern Hemisphere (particularly from Brazil), we normally have an adequate supply of orange juice concentrate that meets our Companys standards.
Patents, Copyrights, Trade Secrets and Trademarks
Our Company owns numerous patents, copyrights and trade secrets, as well as substantial know-how and technology, which we collectively refer to in this report as technology. This technology generally relates to our Companys products and the processes for their production; the packages used for our products; the design and operation of various processes and equipment used in our business; and certain quality assurance software. Some of the technology is licensed to suppliers and other parties. Our sparkling beverage and other beverage formulae are among the important trade secrets of our Company.
We own numerous trademarks that are very important to our business. Depending upon the jurisdiction, trademarks are valid as long as they are in use and/or their registrations are properly maintained. Pursuant to our Bottlers Agreements, we authorize our bottlers to use applicable Company trademarks in connection with their
10
Table of Contents
manufacture, sale and distribution of Company products. In addition, we grant licenses to third parties from time to time to use certain of our trademarks in conjunction with certain merchandise and food products.
Governmental Regulation
Our Company is required to comply, and it is our policy to comply, with applicable laws in the numerous countries throughout the world in which we do business. In many jurisdictions, compliance with competition laws is of special importance to us, and our operations may come under special scrutiny by competition law authorities due to our competitive position in those jurisdictions.
The production, distribution and sale in the United States of many of our Companys products are subject to the Federal Food, Drug, and Cosmetic Act, the Federal Trade Commission Act, the Lanham Act, state consumer protection laws, federal, state and local workplace health and safety laws, various federal, state and local environmental protection laws and various other federal, state and local statutes and regulations applicable to the production, transportation, sale, safety, advertising, labeling and ingredients of such products. Outside the United States, the production, distribution and sale of our many products and related operations are also subject to numerous similar and other statutes and regulations.
A California law requires that a specific warning appear on any product that contains a component listed by the state as having been found to cause cancer or birth defects. The law exposes all food and beverage producers to the possibility of having to provide warnings on their products. This is because the law recognizes no generally applicable quantitative thresholds below which a warning is not required. Consequently, even trace amounts of listed components can expose affected products to the prospect of warning labels. Products containing listed substances that occur naturally or that are contributed to such products solely by a municipal water supply are generally exempt from the warning requirement. No Company beverages produced for sale in California are currently required to display warnings under this law. We are unable to predict whether a component found in a Company product might be added to the California list in the future, although the state has initiated a regulatory process in which caffeine will be evaluated for listing. Furthermore, we are also unable to predict when or whether the increasing sensitivity of detection methodology that may become applicable under this law and related regulations as they currently exist, or as they may be amended, might result in the detection of an infinitesimal quantity of a listed substance in a Company beverage produced for sale in California.
Bottlers of our beverage products presently offer and use nonrefillable, recyclable containers in the United States and various other markets around the world. Some of these bottlers also offer and use refillable containers, which are also recyclable. Legal requirements apply in various jurisdictions in the United States and overseas requiring that deposits or certain ecotaxes or fees be charged for the sale, marketing and use of certain nonrefillable beverage containers. The precise requirements imposed by these measures vary. Other types of beverage container-related deposit, recycling, ecotax and/or product stewardship statutes and regulations also apply in various jurisdictions in the United States and overseas. We anticipate that additional, similar legal requirements may be proposed or enacted in the future at local, state and federal levels, both in the United States and elsewhere.
All of our Companys facilities and other operations in the United States and elsewhere around the world are subject to various environmental protection statutes and regulations, including those relating to the use of water resources and the discharge of wastewater. Our policy is to comply with all such legal requirements. Compliance with these provisions has not had, and we do not expect such compliance to have, any material adverse effect on our Companys capital expenditures, net income or competitive position.
Employees
We refer to our employees as associates. As of December 31, 2007 and 2006, our Company had approximately 90,500 and 71,000 associates, respectively, of which approximately 16,000 and 13,600, respectively, were employed
11
Table of Contents
by entities that we have consolidated under the Financial Accounting Standards Board (FASB) Interpretation No. 46 (revised December 2003), Consolidation of Variable Interest Entities (Interpretation No. 46(R)). At the end of 2007 and 2006, our Company had approximately 13,200 and 12,200 associates, respectively, located in the United States, of which approximately 1,300 and 1,200, respectively, were employed by entities that we have consolidated under Interpretation No. 46(R). The increase in the total number of associates in 2007 was primarily due to acquisitions and the consolidation of certain bottling operations, mainly in the Philippines, Brazil and Germany.
Our Company, through its divisions and subsidiaries, has entered into numerous collective bargaining agreements. We currently expect that we will be able to renegotiate such agreements on satisfactory terms when they expire. The Company believes that its relations with its associates are generally satisfactory.
Securities Exchange Act Reports
The Company maintains a website at the following address: www.thecoca-colacompany.com. The information on the Companys website is not incorporated by reference in this annual report on Form 10-K.
We make available on or through our website certain reports and amendments to those reports that we file with or furnish to the Securities and Exchange Commission (the SEC) in accordance with the Securities Exchange Act of 1934, as amended (the Exchange Act). These include our annual reports on Form 10-K, our quarterly reports on Form 10-Q and our current reports on Form 8-K. We make this information available on our website free of charge as soon as reasonably practicable after we electronically file the information with, or furnish it to, the SEC.
In addition to the other information set forth in this report, you should carefully consider the following factors, which could materially affect our business, financial condition or future results. The risks described below are not the only risks facing our Company. Additional risks and uncertainties not currently known to us or that we currently deem to be immaterial also may materially adversely affect our business, financial condition or results of operations.
Obesity and other health concerns may reduce demand for some of our products.
Consumers, public health officials and government officials are becoming increasingly aware of and concerned about the public health consequences associated with obesity, particularly among young people. In addition, some researchers, health advocates and dietary guidelines are encouraging consumers to reduce consumption of certain types of beverages, especially sugar-sweetened beverages. Increasing public awareness about these issues, possible new governmental regulations concerning the marketing, labeling or availability of our beverages, and negative publicity resulting from actual or threatened legal actions against us or other companies in our industry relating to the marketing, labeling or sale of sparkling beverages may reduce demand for our beverages, which could affect our profitability.
Water scarcity and poor quality could negatively impact the Coca-Cola systems production costs and capacity.
Water is the main ingredient in substantially all of our products. It is also a limited resource in many parts of the world, facing unprecedented challenges from overexploitation, increasing pollution and poor management. As demand for water continues to increase around the world, and as the quality of available water deteriorates, our system may incur increasing production costs or face capacity constraints which could adversely affect our profitability or net operating revenues in the long run.
Changes in the nonalcoholic beverages business environment could impact our financial results.
The nonalcoholic beverages business environment is rapidly evolving as a result of, among other things, changes in consumer preferences, including changes based on health and nutrition considerations and obesity concerns, shifting consumer tastes and needs, changes in consumer lifestyles and competitive product and pricing pressures. In addition,
12
Table of Contents
the industry is being affected by the trend toward consolidation in the retail channel, particularly in Europe and the United States. If we are unable to successfully adapt to this rapidly changing environment, our net income, share of sales and volume growth could be negatively affected.
Increased competition could hurt our business.
The nonalcoholic beverages segment of the commercial beverages industry is highly competitive. We compete with major international beverage companies that, like our Company, operate in multiple geographic areas, as well as numerous firms that are primarily local in operation. In many countries in which we do business, including the United States, PepsiCo, Inc. is a primary competitor. Other significant competitors include, but are not limited to, Nestlé, Cadbury Schweppes plc, Groupe Danone, Kraft Foods Inc. and Unilever. Our ability to gain or maintain share of sales or gross margins in the global market or in various local markets may be limited as a result of actions by competitors.
If we are unable to expand our operations in developing and emerging markets, our growth rate could be negatively affected.
Our success depends in part on our ability to grow our business in developing and emerging markets, which in turn depends on economic and political conditions in those markets and on our ability to acquire or form strategic business alliances with local bottlers and to make necessary infrastructure enhancements to production facilities, distribution networks, sales equipment and technology. Moreover, the supply of our products in developing and emerging markets must match consumers demand for those products. Due to product price, limited purchasing power and cultural differences, there can be no assurance that our products will be accepted in any particular developing or emerging market.
Fluctuations in foreign currency exchange could affect our financial results.
We earn revenues, pay expenses, own assets and incur liabilities in countries using currencies other than the U.S. dollar, including the euro, the Japanese yen, the Brazilian real and the Mexican peso. In 2007, we used 67 functional currencies in addition to the U.S. dollar and derived approximately 74 percent of our net operating revenues from operations outside of the United States. Because our consolidated financial statements are presented in U.S. dollars, we must translate revenues, income and expenses, as well as assets and liabilities, into U.S. dollars at exchange rates in effect during or at the end of each reporting period. Therefore, increases or decreases in the value of the U.S. dollar against other major currencies will affect our net operating revenues, operating income and the value of balance sheet items denominated in foreign currencies. Because of the geographic diversity of our operations, weaknesses in some currencies might be offset by strengths in others over time. We also use derivative financial instruments to further reduce our net exposure to currency exchange rate fluctuations. However, we cannot assure you that fluctuations in foreign currency exchange rates, particularly the strengthening of the U.S. dollar against major currencies, would not materially affect our financial results.
If interest rates increase, our net income could be negatively affected.
We maintain levels of debt that we consider prudent based on our cash flows, interest coverage ratio and percentage of debt to capital. We use debt financing to lower our cost of capital, which increases our return on shareowners equity. This exposes us to adverse changes in interest rates. When appropriate, we use derivative financial instruments to reduce our exposure to interest rate risks. We cannot assure you, however, that our financial risk management program will be successful in reducing the risks inherent in exposures to interest rate fluctuations. Our interest expense is also affected by our credit ratings. In assessing our credit strength, credit rating agencies consider our capital structure and financial policies as well as the aggregate balance sheet and other financial information for the Company and certain major bottlers. It is our expectation that the credit rating agencies will continue using this methodology. If our credit ratings were to be downgraded as a result of changes in our capital structure, our major bottlers financial performance, changes in the credit rating agencies methodology in assessing
13
Table of Contents
our credit strength or for any other reason, our cost of borrowing could increase. Additionally, if the credit ratings of certain bottlers in which we have equity investments were to be downgraded, such bottlers interest expense could increase, which would reduce our equity income.
We rely on our bottling partners for a significant portion of our business. If we are unable to maintain good relationships with our bottling partners, our business could suffer.
We generate a significant portion of our net operating revenues by selling concentrates and syrups to bottling partners in which we do not have any ownership interest or in which we have a noncontrolling ownership interest. In 2007, approximately 79 percent of our worldwide unit case volume was produced and distributed by bottling partners in which the Company did not have controlling interests. As independent companies, our bottling partners, some of which are publicly traded companies, make their own business decisions that may not always align with our interests. In addition, many of our bottling partners have the right to manufacture or distribute their own products or certain products of other beverage companies. If we are unable to provide an appropriate mix of incentives to our bottling partners through a combination of pricing and marketing and advertising support, they may take actions that, while maximizing their own short-term profits, may be detrimental to our Company or our brands, or they may devote more of their energy and resources to business opportunities or products other than those of the Company. Such actions could, in the long run, have an adverse effect on our profitability. In addition, the loss of one or more major customers by one of our major bottling partners, or disruptions of bottling operations that may be caused by strikes, work stoppages or labor unrest affecting such bottling partners, could indirectly affect our results.
If our bottling partners financial condition deteriorates, our business and financial results could be affected.
The success of our business depends on the financial strength and viability of our bottling partners. Our bottling partners financial condition is affected in large part by conditions and events that are beyond our control, including competitive and general market conditions in the territories in which they operate and the availability of capital and other financing resources on reasonable terms. While under our bottling partners agreements we generally have the right to unilaterally change the prices we charge for our concentrates and syrups, our ability to do so may be materially limited by the financial condition of the applicable bottling partners and their ability to pass price increases along to their customers. In addition, because we have investments in certain of our bottling partners, which we account for under the equity method, our operating results include our proportionate share of such bottling partners income or loss. Also, a deterioration of the financial condition of bottling partners in which we have investments could affect the carrying values of such investments and result in write-offs. Therefore, a significant deterioration of our bottling partners financial condition could adversely affect our financial results.
If we are unable to renew collective bargaining agreements on satisfactory terms, or we or our bottling partners experience strikes, work stoppages or labor unrest, our business could suffer.
Many of our associates at our key manufacturing locations and bottling plants are covered by collective bargaining agreements. If we are unable to renew such agreements on satisfactory terms, our labor costs could increase, which would affect our profit margins. In addition, many of our bottling partners employees are represented by labor unions. Strikes, work stoppages or other forms of labor unrest at any of our major manufacturing facilities or at our major bottlers plants could impair our ability to supply concentrates and syrups to our bottling partners or our bottlers ability to supply finished beverages to customers, which would reduce our revenues and could expose us to customer claims.
Increase in the cost of energy could affect our profitability.
Our Company-owned bottling operations and our bottling partners operate a large fleet of trucks and other motor vehicles. In addition, we and our bottlers use a significant amount of electricity, natural gas and other energy sources to operate our concentrate and bottling plants. An increase in the price of fuel and other energy sources would increase our and the Coca-Cola systems operating costs and, therefore, could negatively impact our profitability.
14
Table of Contents
Increase in cost, disruption of supply or shortage of raw and packaging materials could harm our business.
We and our bottling partners use various raw materials in our business, including high fructose corn syrup, sucrose, aspartame, saccharin, acesulfame potassium, sucralose and orange juice concentrate, as well as packaging materials such as polyethylene terephthalate (PET or plastic) for bottles and aluminum for cans. The prices for these raw and packaging materials fluctuate depending on market conditions. Substantial increases in the prices for our or our bottling partners raw and packaging materials, to the extent they cannot be recouped through increases in the prices of finished beverage products, would increase our and the Coca-Cola systems operating costs and could reduce our profitability. Increases in the prices of our finished products resulting from higher raw and packaging material costs could affect affordability in some markets and reduce Coca-Cola system sales. In addition, some of these raw materials, such as aspartame, acesulfame potassium and sucralose, as well as some of the packaging containers, such as aluminum cans, are available from a limited number of suppliers. We cannot assure you that we and our bottling partners will be able to maintain favorable arrangements and relationships with these suppliers. An increase in the cost, a sustained interruption in the supply, or a shortage of some of these raw materials, packaging materials or cans and other containers that may be caused by a deterioration of our or our bottling partners relationships with suppliers, or by events such as natural disasters, power outages, labor strikes or the like, could negatively impact our net revenues and profits.
Changes in laws and regulations relating to beverage containers and packaging could increase our costs and reduce demand for our products.
We and our bottlers currently offer nonrefillable, recyclable containers in the United States and in various other markets around the world. Legal requirements have been enacted in various jurisdictions in the United States and overseas requiring that deposits or certain ecotaxes or fees be charged for the sale, marketing and use of certain nonrefillable beverage containers. Other beverage container-related deposit, recycling, ecotax and/or product stewardship proposals have been introduced in various jurisdictions in the United States and overseas, and we anticipate that similar legislation or regulations may be proposed in the future at local, state and federal levels, both in the United States and elsewhere. Consumers increased concerns and changing attitudes about solid waste streams and environmental responsibility and related publicity could result in the adoption of such legislation or regulations. If these types of requirements are adopted and implemented on a large scale in any of the major markets in which we operate, they could affect our costs or require changes in our distribution model, which could reduce our net operating revenues or profitability. In addition, container-deposit laws, or regulations that impose additional burdens on retailers, could cause a shift away from our products to retailer-proprietary brands, which could impact the demand for our products in the affected markets.
Significant additional labeling or warning requirements may inhibit sales of affected products.
Various jurisdictions may seek to adopt significant additional product labeling or warning requirements relating to the chemical content or perceived adverse health consequences of certain of our products. These types of requirements, if they become applicable to one or more of our major products under current or future environmental or health laws or regulations, may inhibit sales of such products. In California, a law requires that a specific warning appear on any product that contains a component listed by the state as having been found to cause cancer or birth defects. The state has initiated a regulatory process in which caffeine will be evaluated for listing under this law. This law recognizes no generally applicable quantitative thresholds below which a warning is not required. If a component found in one of our products, such as caffeine, is added to the list, or if the increasing sensitivity of detection methodology that may become available under this law and related regulations as they currently exist, or as they may be amended, results in the detection of an infinitesimal quantity of a listed substance in one of our beverages produced for sale in California, the resulting warning requirements or adverse publicity could affect our sales.
15
Table of Contents
Unfavorable general economic conditions in the United States or in other major markets could negatively impact our financial performance.
Unfavorable general economic conditions, such as a recession or economic slowdown in the United States or in one or more of our other major markets, could negatively affect the affordability of and consumer demand for some of our beverages. Under difficult economic conditions, consumers may seek to reduce discretionary spending by forgoing purchases of our products or by shifting away from our beverages to lower-priced products offered by other companies. Softer consumer demand for our beverages in the United States or in other major markets could reduce the Coca-Cola systems profitability and could negatively affect our financial performance.
Unfavorable economic and political conditions in international markets could hurt our business.
We derive a significant portion of our net operating revenues from sales of our products in international markets. In 2007, our operations outside of the United States accounted for approximately 74 percent of our net operating revenues. Unfavorable economic and political conditions in certain of our international markets, including civil unrest and governmental changes, could undermine consumer confidence and reduce the consumers purchasing power, thereby reducing demand for our products. In addition, product boycotts resulting from political activism could reduce demand for our products, while restrictions on our ability to transfer earnings or capital across borders that may be imposed or expanded as a result of political and economic instability could impact our profitability. Without limiting the generality of the preceding sentence, the current unstable economic and political conditions and civil unrest and political activism in the Middle East, India or the Philippines, the unstable situation in Iraq, or the continuation or escalation of terrorist activities could adversely impact our international business.
Changes in commercial and market practices within the European Economic Area may affect the sales of our products.
We and our bottlers are subject to an Undertaking, rendered legally binding in June 2005 by a decision of the European Commission, pursuant to which we committed to make certain changes in our commercial and market practices in the European Economic Area Member States. The Undertaking potentially applies in 27 countries and in all channels of distribution where certain of our sparkling beverages account for over 40 percent of national sales and twice the nearest competitors share. The commitments we and our bottlers made in the Undertaking relate broadly to exclusivity, percentage-based purchasing commitments, transparency, target rebates, tying, assortment or range commitments, and agreements concerning products of other suppliers. The Undertaking also applies to shelf space commitments in agreements with take-home customers and to financing and availability agreements in the on-premise channel. In addition, the Undertaking includes commitments that are applicable to commercial arrangements concerning the installation and use of technical equipment (such as coolers, fountain equipment and vending machines). Adjustments to our business model in the European Economic Area Member States as a result of these commitments or of future interpretations of European Union competition laws and regulations could adversely affect our sales in the European Economic Area markets.
Litigation or legal proceedings could expose us to significant liabilities and damage our reputation.
We are party to various litigation claims and legal proceedings. We evaluate these litigation claims and legal proceedings to assess the likelihood of unfavorable outcomes and to estimate, if possible, the amount of potential losses. Based on these assessments and estimates, we establish reserves and/or disclose the relevant litigation claims or legal proceedings, as appropriate. These assessments and estimates are based on the information available to management at the time and involve a significant amount of management judgment. We caution you that actual outcomes or losses may differ materially from those envisioned by our current assessments and estimates. In addition, we have bottling and other business operations in emerging or developing markets with high-risk legal compliance environments. Our policies and procedures require strict compliance by our associates and agents with all United States and local laws and regulations applicable to our business operations, including those prohibiting improper payments to government officials. Nonetheless, we cannot assure you that our policies, procedures and related training programs
16
Table of Contents
will always ensure full compliance by our associates and agents with all applicable legal requirements. Improper conduct by our associates or agents could damage our reputation in the United States and internationally or lead to litigation or legal proceedings that could result in civil or criminal penalties, including substantial monetary fines, as well as disgorgement of profits.
Adverse weather conditions could reduce the demand for our products.
The sales of our products are influenced to some extent by weather conditions in the markets in which we operate. Unusually cold or rainy weather during the summer months may have a temporary effect on the demand for our products and contribute to lower sales, which could have an adverse effect on our results of operations for such periods.
If we are unable to maintain brand image and product quality, or if we encounter other product issues such as product recalls, our business may suffer.
Our success depends on our ability to maintain brand image for our existing products and effectively build up brand image for new products and brand extensions. We cannot assure you, however, that additional expenditures and our continuing commitment to advertising and marketing will have the desired impact on our products brand image and on consumer preferences. Product quality issues, real or imagined, or allegations of product contamination, even when false or unfounded, could tarnish the image of the affected brands and may cause consumers to choose other products. In addition, because of allegations of product contamination, we may be required from time to time to recall products entirely or from specific markets. Product recalls could affect our profitability and could negatively affect brand image. Also, adverse publicity surrounding obesity concerns, water usage, labor relations and the like could negatively affect our Companys overall reputation and our products acceptance by consumers.
Changes in the legal and regulatory environment in the countries in which we operate could increase our costs or reduce our net operating revenues.
Our Companys business is subject to various laws and regulations in the numerous countries throughout the world in which we do business, including laws and regulations relating to competition, product safety, advertising and labeling, container deposits, recycling or stewardship, the protection of the environment, and employment and labor practices. In the United States, the production, distribution and sale of many of our products are subject to, among others, the Federal Food, Drug, and Cosmetic Act, the Federal Trade Commission Act, the Lanham Act, state consumer protection laws, the Occupational Safety and Health Act, various environmental statutes, as well as various state and local statutes and regulations. Outside the United States, the production, distribution, sale, advertising and labeling of many of our products are also subject to various laws and regulations. Changes in applicable laws or regulations or evolving interpretations thereof could, in certain circumstances, result in increased compliance costs or capital expenditures, which could affect our profitability, or impede the production or distribution of our products, which could affect our net operating revenues.
Changes in accounting standards and taxation requirements could affect our financial results.
New accounting standards or pronouncements that may become applicable to our Company from time to time, or changes in the interpretation of existing standards and pronouncements, could have a significant effect on our reported results for the affected periods. We are also subject to income tax in the numerous jurisdictions in which we generate net operating revenues. In addition, our products are subject to import and excise duties and/or sales or value-added taxes in many jurisdictions in which we operate. Increases in income tax rates could reduce our after-tax income from affected jurisdictions, while increases in indirect taxes could affect our products affordability and therefore reduce demand for our products.
17
Table of Contents
If we are not able to achieve our overall long-term goals, the value of an investment in our Company could be negatively affected.
We have established and publicly announced certain long-term growth objectives. These objectives were based on our evaluation of our growth prospects, which are generally based on volume and sales potential of many product types, some of which are more profitable than others, and on an assessment of potential level or mix of product sales. There can be no assurance that we will achieve the required volume or revenue growth or mix of products necessary to achieve our growth objectives.
If we are unable to protect our information systems against data corruption, cyber-based attacks or network security breaches, our operations could be disrupted.
We are increasingly dependent on information technology networks and systems, including the Internet, to process, transmit and store electronic information. In particular, we depend on our information technology infrastructure for digital marketing activities and electronic communications among our locations around the world and between Company personnel and our bottlers and other customers and suppliers. Security breaches of this infrastructure can create system disruptions, shutdowns or unauthorized disclosure of confidential information. If we are unable to prevent such breaches, our operations could be disrupted, or we may suffer financial damage or loss because of lost or misappropriated information.
We may be required to recognize additional impairment charges.
We assess our goodwill, trademarks and other intangible assets and our long-lived assets as and when required by generally accepted accounting principles in the United States to determine whether they are impaired. In 2007, we recorded net charges of approximately $150 million related to our proportionate share of impairment and restructuring charges partially offset by our proportionate share of tax rate changes recorded by certain equity investees. Refer to the heading Equity IncomeNet of Item 7. Managements Discussion and Analysis of Financial Condition and Results of Operations of this report. In 2006, we recorded a charge of approximately $602 million to equity income resulting from the impact of our proportionate share of an impairment charge recorded by CCE, and impairment charges of approximately $41 million primarily related to trademarks for beverages sold in the Philippines and Indonesia; and in 2005, we recorded impairment charges of approximately $89 million primarily related to our operations and investments in the Philippines. If market conditions in certain territories in Europe or Asia in which our Company has significant investments in bottling operations deteriorate, we may be required to record additional impairment charges. In addition, unexpected declines in our operating results and structural changes in these and other markets may also result in impairment charges. Additional impairment charges would reduce our reported earnings for the periods in which they are recorded.
If we do not successfully manage our Company-owned bottling operations, our results could suffer.
While we primarily manufacture, market and sell concentrates and syrups to our bottling partners, from time to time we do acquire or take control of bottling operations and have increasingly done so in recent years. As of December 31, 2007, the net operating revenues generated by Company-owned and controlled bottling operations (which are included in the Bottling Investments operating segment) represented approximately 26 percent of our Companys consolidated net operating revenues. Often, though not always, these acquired bottling operations are in underperforming markets where we believe we can use our resources and expertise to improve performance. Acquisitions and consolidation of controlled bottling operations during 2007 have resulted in a substantial increase in the number of Company-owned bottling plants included in our consolidated financial statements and in the number of our associates. We may incur unforeseen liabilities and obligations in connection with acquiring, taking control of or managing bottling operations and may encounter unexpected difficulties and costs in restructuring and integrating them into our Companys operating and internal control structures. We may also experience delays in extending our Companys internal control over financial reporting to newly acquired bottling operations which may increase the risk of failure to prevent misstatements in such operations financial records. In addition, our financial performance and the strength and efficiency of the Coca-Cola system depend in part on how well we can manage and improve the performance of Company-owned or controlled bottling operations. We cannot assure you, however, that we will be able to achieve our strategic and financial objectives for such bottling operations.
18
Table of Contents
Global or regional catastrophic events could impact our operations and financial results.
Because of our global presence and worldwide operations, our business can be affected by large-scale terrorist acts, especially those directed against the United States or other major industrialized countries; the outbreak or escalation of armed hostilities; major natural disasters; or widespread outbreaks of infectious diseases such as avian influenza or severe acute respiratory syndrome (generally known as SARS). Such events could impair our ability to manage our business around the world, could disrupt our supply of raw materials, and could impact production, transportation and delivery of concentrates, syrups and finished products. In addition, such events could cause disruption of regional or global economic activity, which can affect consumers purchasing power in the affected areas and, therefore, reduce demand for our products.
ITEM 1B. UNRESOLVED STAFF COMMENTS
Not applicable.
Our worldwide headquarters is located on a 35-acre office complex in Atlanta, Georgia. The complex includes the approximately 621,000 square foot headquarters building, the approximately 870,000 square foot Coca-Cola North America (CCNA) building and the approximately 264,000 square foot Coca-Cola Plaza building. The complex also includes several other buildings, including technical and engineering facilities, a learning center and a reception center. Our Company leases approximately 250,000 square feet of office space at 10 Glenlake Parkway, Atlanta, Georgia, which we currently sublease to third parties. In addition, we lease approximately 218,000 square feet of office space at Northridge Business Park, Dunwoody, Georgia. We own or lease additional real estate, including a Company-owned office and retail building at 711 Fifth Avenue in New York, New York. These properties are primarily included in the Corporate operating segment.
The Company has facilities for administrative operations, manufacturing, processing, packaging, packing, storage and warehousing throughout the United States and Canada, including a portion of the Atlanta office complex, which are included in our North America operating segment. In addition, in North America, we own nine still beverage production facilities and four bottled water facilities, lease one bottled water facility, and own a facility that manufactures juice concentrates for foodservice use, all of which are included in the North America operating segment.
We own or hold a majority interest in or otherwise consolidate under applicable accounting rules bottling operations that own 136 principal beverage bottling and canning plants located throughout the world. These plants are included in the Bottling Investments operating segment.
We own a facility in Brussels, Belgium, which consists of approximately 315,000 square feet of office and technical space. This facility is included in the European Union operating segment. We also own or lease real estate, office space and other facilities throughout the world which are used for administrative facilities, warehouses and retail operations. In addition, as of December 31, 2007, our Company owned and operated 30 principal beverage concentrate and/or syrup manufacturing plants located throughout the world. These properties are generally included in the geographic operating segment in which they are located.
Management believes that our Companys facilities for the production of our products are suitable and adequate, that they are being appropriately utilized in line with past experience, and that they have sufficient production capacity for their present intended purposes. The extent of utilization of such facilities varies based upon seasonal demand for our products. It is not possible to measure with any degree of certainty or uniformity the productive capacity and extent of utilization of these facilities. However, management believes that additional production can be obtained at the existing facilities by adding personnel and capital equipment and, at some facilities, by adding shifts of personnel or expanding the facilities. We continuously review our anticipated requirements for facilities and, on the basis of that review, may from time to time acquire additional facilities and/or dispose of existing facilities.
19
Table of Contents
The Company is involved in various legal proceedings, including the proceedings specifically discussed below. Management of the Company believes that any liability to the Company that may arise as a result of these proceedings will not have a material adverse effect on the financial condition of the Company and its subsidiaries taken as a whole.
Carpenters
On October 27, 2000, a class action lawsuit (Carpenters Health & Welfare Fund of Philadelphia & Vicinity v. The Coca-Cola Company, et al.) was filed in the United States District Court for the Northern District of Georgia alleging that the Company, M. Douglas Ivester, Jack L. Stahl and James E. Chestnut violated antifraud provisions of the federal securities laws by making misrepresentations or material omissions relating to the Companys financial condition and prospects in late 1999 and early 2000. A second, largely identical lawsuit (Gaetan LaValla v. The Coca-Cola Company, et al.) was filed in the same court on November 9, 2000. The complaints allege that the Company and the individual named officers: (1) forced certain Coca-Cola system bottlers to accept excessive, unwanted and unneeded sales of concentrate during the third and fourth quarters of 1999, thus creating a misleading sense of improvement in our Companys performance in those quarters; (2) failed to write down the value of impaired assets in Russia, Japan and elsewhere on a timely basis, again resulting in the presentation of misleading interim financial results in the third and fourth quarters of 1999; and (3) misrepresented the reasons for Mr. Ivesters departure from the Company and then misleadingly reassured the financial community that there would be no changes in the Companys core business strategy or financial outlook following that departure. Damages in an unspecified amount are sought in both complaints.
On January 8, 2001, an order was entered by the United States District Court for the Northern District of Georgia consolidating the two cases for all purposes. The Court also ordered the plaintiffs to file a Consolidated Amended Complaint. On July 25, 2001, the plaintiffs filed a Consolidated Amended Complaint, which largely repeated the allegations made in the original complaints and added Douglas N. Daft as an additional defendant.
On September 25, 2001, the defendants filed a Motion to Dismiss all counts of the Consolidated Amended Complaint. On August 20, 2002, the Court granted in part and denied in part the defendants Motion to Dismiss. The Court also granted the plaintiffs Motion for Leave to Amend the Complaint. On September 4, 2002, the defendants filed a Motion for Partial Reconsideration of the Courts August 20, 2002 ruling. The motion was denied by the Court on April 15, 2003.
On June 2, 2003, the plaintiffs filed an Amended Consolidated Complaint. The defendants moved to dismiss the Amended Complaint on June 30, 2003. On March 31, 2004, the Court granted in part and denied in part the defendants Motion to Dismiss the Amended Complaint. In its order, the Court dismissed a number of the plaintiffs allegations, including the claim that the Company made knowingly false statements to financial analysts. The Court permitted the remainder of the allegations to proceed to discovery. The Court denied the plaintiffs request for leave to further amend and replead their complaint. The fact discovery closed on March 23, 2007, pursuant to the Courts order. However, there remain certain unresolved issues relating to discovery pending before the Court.
In August 2007, the Court heard oral argument on plaintiffs motion to certify the class and the Companys opposition thereto. A ruling on that motion is currently pending before the Court. In October 2007, the Company filed various motions for summary judgment and related relief. Briefing on the Companys motions is ongoing.
The Company believes it has substantial legal and factual defenses to the plaintiffs claims.
Aqua-Chem Litigation
On December 20, 2002, the Company filed a lawsuit (The Coca-Cola Company v. Aqua-Chem, Inc., Civil Action No. 2002CV631-50) in the Superior Court, Fulton County, Georgia (the Georgia Case), seeking a declaratory
20
Table of Contents
judgment that the Company has no obligation to its former subsidiary, Aqua-Chem, Inc., now known as Cleaver-Brooks, Inc. (Aqua-Chem), for any past, present or future liabilities or expenses in connection with any claims or lawsuits against Aqua-Chem. Subsequent to the Companys filing but on the same day, Aqua-Chem filed a lawsuit (Aqua-Chem, Inc. v. The Coca-Cola Company, Civil Action No. 02CV012179) in the Circuit Court, Civil Division of Milwaukee County, Wisconsin (the Wisconsin Case). In the Wisconsin Case, Aqua-Chem sought a declaratory judgment that the Company is responsible for all liabilities and expenses not covered by insurance in connection with certain of Aqua-Chems general and product liability claims arising from occurrences prior to the Companys sale of Aqua-Chem in 1981, and a judgment for breach of contract in an amount exceeding $9 million for costs incurred by Aqua-Chem to date in connection with such claims. The Wisconsin Case initially was stayed, pending final resolution of the Georgia Case, and later was voluntarily dismissed without prejudice by Aqua-Chem.
The Company owned Aqua-Chem from 1970 to 1981. During that time, the Company purchased over $400 million of insurance coverage, of which approximately $350 million is still available to cover Aqua-Chems costs for certain product liability and other claims. The Company sold Aqua-Chem to Lyonnaise American Holding, Inc. in 1981 under the terms of a stock sale agreement. The 1981 agreement, and a subsequent 1983 settlement agreement, outlined the parties rights and obligations concerning past and future claims and lawsuits involving Aqua-Chem. Cleaver-Brooks, a division of Aqua-Chem, manufactured boilers, some of which contained asbestos gaskets. Aqua-Chem was first named as a defendant in asbestos lawsuits in or around 1985 and currently has more than 100,000 claims pending against it.
The parties agreed in 2004 to stay the Georgia Case pending the outcome of insurance coverage litigation filed by certain Aqua-Chem insurers on March 26, 2004. In the coverage action, five plaintiff insurance companies filed suit (Century Indemnity Company, et al. v. Aqua-Chem, Inc., The Coca-Cola Company, et al., Case No. 04CV002852) in the Circuit Court, Civil Division of Milwaukee County, Wisconsin, against the Company, Aqua-Chem and 16 insurance companies. Several of the policies that are the subject of the coverage action were issued to the Company during the period (1970 to 1981) when the Company owned Aqua-Chem. The complaint seeks a determination of the respective rights and obligations under the insurance policies issued with regard to asbestos-related claims against Aqua-Chem. The action also seeks a monetary judgment reimbursing any amounts paid by the plaintiffs in excess of their obligations. Two of the insurers, one with a $15 million policy limit and one with a $25 million policy limit, asserted cross-claims against the Company, alleging that the Company and/or its insurers are responsible for Aqua-Chems asbestos liabilities before any obligation is triggered on the part of the cross-claimant insurers to pay for such costs under their policies.
Aqua-Chem and the Company filed and obtained a partial summary judgment determination in the coverage action that the insurers for Aqua-Chem and the Company were jointly and severally liable for coverage amounts, but reserving judgment on other defenses that might apply. During the course of the Wisconsin coverage litigation, Aqua-Chem and the Company reached settlements with several of the insurers, including plaintiffs, who have paid or will pay funds into an escrow account for payment of costs arising from the asbestos claims against Aqua-Chem. On July 24, 2007, the Wisconsin trial court entered a final declaratory judgment regarding the rights and obligations of the parties under the insurance policies issued by the remaining defendant insurers, which judgment was not appealed. The judgment directs, among other things, that each insurer whose policy is triggered is jointly and severally liable for 100 percent of Aqua-Chems losses up to policy limits.
The courts judgment concludes the Wisconsin insurance coverage litigation. The Georgia Case remains subject to the stay agreed to in 2004.
European Union Parallel Trade Matter
The Company has had discussions with the Competition Directorate of the European Commission (the European Commission) about issues relating to parallel trade within the European Union arising out of comments received by the European Commission from third parties. The Company has fully cooperated with the European Commission and has provided information on these issues and the measures taken and to be taken to address them.
21
Table of Contents
The Company is unable to predict at this time with any reasonable degree of certainty what action, if any, the European Commission will take with respect to these issues.
Selbst and Amalgamated
In May and July 2005, two putative class action lawsuits (Selbst v. The Coca-Cola Company and Douglas N. Daft and Amalgamated Bank, et al. v. The Coca-Cola Company, Douglas N. Daft, E. Neville Isdell, Steven J. Heyer and Gary P. Fayard) alleging violations of the anti-fraud provisions of the federal securities laws were filed in the United States District Court for the Northern District of Georgia against the Company and certain current and former executive officers. These cases were subsequently consolidated, and an amended and consolidated complaint was filed in September 2005. The purported class consists of persons, except the defendants, who purchased Company stock between January 30, 2003, and September 15, 2004, and were damaged thereby. The amended and consolidated complaint alleges, among other things, that during the class period the defendants made false and misleading statements about (a) the Companys new business strategy/model, (b) the Companys execution of its new business strategy/model, (c) the state of the Companys critical bottler relationships, (d) the Companys North American business, (e) the Companys European operations, with a particular emphasis on Germany, (f) the Companys marketing and introduction of new products, particularly Coca-Cola C2, and (g) the Companys forecast for growth going forward. The plaintiffs claim that as a result of these allegedly false and misleading statements, the price of the Company stock increased dramatically during the purported class period. The amended and consolidated complaint also alleges that in September and November of 2004, the Company and E. Neville Isdell acknowledged that the Companys performance had been below expectations, that various corrective actions were needed, that the Company was lowering its forecasts, and that there would be no quick fixes. In addition, the amended and consolidated complaint alleges that the charge announced by the Company in November 2004 should have been taken early in 2003 and that, as a result, the Companys financial statements were materially misstated during 2003 and the first three quarters of 2004. The plaintiffs, on behalf of the putative class, seek compensatory damages in an amount to be proved at trial, extraordinary, equitable and/or injunctive relief as permitted by law to assure that the class has an effective remedy, award of reasonable costs and expenses, including counsel and expert fees, and such other further relief as the Court may deem just and proper. On November 21, 2005, the Company and the individual parties filed a motion to dismiss the amended and consolidated complaint. The plaintiffs filed their response to that motion on January 27, 2006. On September 29, 2006, the Court entered its order granting the Companys motion to dismiss the amended complaint in its entirety and granted the plaintiffs 20 days from its date of entry within which to seek leave to file a second amended complaint to attempt to correct deficiencies noted therein. On October 23, 2006, plaintiffs advised the Court that they would not seek leave to file a second amended complaint. The Court entered its final order of judgment on March 23, 2007. On April 16, 2007, plaintiffs filed notice of appeal to the United States Court of Appeals for the Eleventh Circuit of the Courts order dismissing this case. On December 4, 2007, the Court of Appeals heard argument on the appeal. On January 10, 2008, the Court of Appeals issued an opinion affirming the dismissal of the case.
The plaintiffs may file a petition of certiorari with the U.S. Supreme Court; however, barring the U.S. Supreme Court granting such a petition, this matter will be considered closed.
Chapman
On June 30, 2005, Maryann Chapman filed a purported shareholder derivative action (Chapman v. Isdell, et al.) in the Superior Court of Fulton County, Georgia, alleging violations of state law by certain individual current and former members of the Board of Directors of the Company and senior management, including breaches of fiduciary duties, abuse of control, gross mismanagement, waste of corporate assets and unjust enrichment, between January 2003 and the date of filing of the complaint that have caused substantial losses to the Company and other damages, such as to its reputation and goodwill. The defendants named in the lawsuit include Neville Isdell, Douglas Daft, Gary Fayard, Ronald Allen, Cathleen Black, Warren Buffett, Herbert Allen, Barry Diller, Donald McHenry, Sam Nunn, James Robinson, Peter Ueberroth, James Williams, Donald Keough, Maria Lagomasino, Pedro Reinhard, Robert Nardelli and Susan Bennett King. The Company is also named a nominal defendant. The complaint further alleges that the
22
Table of Contents
September 2004 earnings warning issued by the Company resulted from factors known by the individual defendants as early as January 2003 that were not adequately disclosed to the investing public until the earnings warning. The factors cited in the complaint include (i) a flawed business strategy and a business model that was not working; (ii) a workforce so depleted by layoffs that it was unable to properly react to changing market conditions; (iii) impaired relationships with key bottlers; and (iv) the fact that the foregoing conditions would lead to diminished earnings. The plaintiff, purportedly on behalf of the Company, seeks damages in an unspecified amount, extraordinary equitable and/or injunctive relief, restitution and disgorgement of profits, reimbursement for costs and disbursements of the action, and such other and further relief as the Court deems just and proper. The Companys motion to dismiss the complaint and the plaintiffs response were filed and fully briefed. The Court heard oral argument on the Companys motion to dismiss on June 6, 2006. Following the hearing, the Court took the matter under advisement and the parties are awaiting a ruling. There were no material developments in this case during 2007.
The Company intends to vigorously defend its interests in this matter.
CCE Shareholders Litigation
In February 2006, the International Brotherhood of Teamsters, a purported shareholder of CCE, filed a derivative suit (International Brotherhood of Teamsters v. The Coca-Cola Company, et al.) in the Delaware Court of Chancery for New Castle County naming the Company and current and former CCE board members, including certain current and former Company officers who serve or served on CCEs board, as defendants. The plaintiff alleged that the Company breached fiduciary duties owed to CCE shareholders based upon alleged control of CCE by the Company. The complaint also alleged that the Company had actual control over CCE and that the Company abused its control by maximizing its own financial condition at the expense of CCEs financial condition. Subsequently, two lawsuits virtually identical to Teamsters were filed in the same court: Lang v. The Coca-Cola Company, et al., filed March 30, 2006, and Gordon v. The Coca-Cola Company, et al., filed April 10, 2006. On April 6, 2006, the Company moved to dismiss Teamsters or, in the alternative, for a stay of discovery. On May 19, 2006, the Chancery Court entered an order consolidating Teamsters, Lang and Gordon under the caption In re Coca-Cola Enterprises, Inc. Shareholders Litigation and requiring the plaintiffs to file an amended consolidated complaint in the consolidated action as soon as practicable.
On September 29, 2006, plaintiffs filed their Consolidated Amended Shareholders Derivative Complaint (the Amended Complaint). The Amended Complaint omits certain former Company officers from the group of individual defendants and defines the relevant time period for purposes of the claims as October 15, 2003, through the date of the filing. The original complaint did not identify any specific dates. The Amended Complaint also includes additional allegations about the conduct of the Company and certain of its executive officers, including new allegations about the Companys purported control over CCE and allegations of improper conduct in connection with the establishment of a warehouse delivery system to supply Powerade to a major customer. On December 7, 2006, the Company filed its motion to dismiss the Amended Complaint and accompanying brief. The plaintiffs reply brief was filed on January 22, 2007. On October 17, 2007, the Chancery Court dismissed plaintiffs Amended Complaint. The plaintiffs appealed the Chancery Courts decision to the Delaware Supreme Court.
The Company will vigorously defend its interests on appeal.
American Canyon Matter
The Company has received notices of violations from local environmental authorities alleging that certain violations of the United States Clean Water Act (the CWA) and applicable local law have occurred at the Companys production plant in American Canyon, California. That plant treats and discharges wastewater under permit authority issued under the CWA and local law. The alleged violations relate to handling of wastewater discharge and required regulatory reporting. The Company believes that the regulatory authorities may pursue enforcement action against the Company and may seek potential monetary and/or other sanctions, although the Company believes that any sanctions that may be imposed on the Company as a result of these alleged violations will not be material to the Companys business or financial condition.
The Company is working with the local environmental authorities to resolve and settle the matter.
23
Table of Contents
ITEM 4. SUBMISSION OF MATTERS TO A VOTE OF SECURITY HOLDERS
Not applicable.
ITEM X. EXECUTIVE OFFICERS OF THE COMPANY
The following are the executive officers of our Company as of February 22, 2008:
Ahmet C. Bozer, 47, is President of the Eurasia Group. Mr. Bozer joined the Company in 1990 as a Financial Control Manager for Coca-Cola USA and held a number of other roles in the finance organization. In 1994, he joined Coca-Cola Bottlers of Turkey (now Coca-Cola Icecek A.S.), a joint venture among the Company, The Anadolu Group and Özgörkey Companies, as Chief Financial Officer and was later named Managing Director in 1998. In 2000, Mr. Bozer was named President of the Eurasia Division of the Company. At the end of 2002, that division was reorganized to include the Middle East Division and was renamed the Eurasia and Middle East Division. During the period between 2000 until 2006, the Eurasia and Middle East Division was expanded to include 34 countries and, in 2006, Mr. Bozer assumed the additional leadership responsibility for the Russia, Ukraine and Belarus Division. Mr. Bozer was appointed to his current position effective January 1, 2007.
Alexander B. Cummings, 51, is President of the Africa Group. Mr. Cummings joined the Company in 1997 as Deputy Region Manager, Nigeria, based in Lagos, Nigeria. In 1998, he was made Managing Director/Region Manager, Nigeria. In 2000, Mr. Cummings became President of the North West Africa Division based in Morocco and in 2001 became President of the Africa Group overseeing the entire African continent. Mr. Cummings started his career in 1982 with The Pillsbury Company and held various positions within Pillsbury, the last position being Vice President of Finance and Chief Financial Officer for all of Pillsburys international businesses. Mr. Cummings was appointed to his current position in March 2001.
J. Alexander M. Douglas, Jr., 46, is Senior Vice President and President of the North America Group. Mr. Douglas joined the Company in January 1988 as a District Sales Manager for the Foodservice Division of Coca-Cola USA. In May 1994, he was named Vice President of Coca-Cola USA, initially assuming leadership of the CCE Sales & Marketing Group and eventually assuming leadership of the entire North American Field Sales and Marketing Groups. In January 2000, Mr. Douglas was appointed President of the North American Division within the North America Group. He served as Senior Vice President and Chief Customer Officer of the Company from February 2003 until August 2006. Mr. Douglas was elected to his current position in August 2006.
Gary P. Fayard, 55, is Executive Vice President and Chief Financial Officer of the Company. Mr. Fayard joined the Company in April 1994. In July 1994, he was elected Vice President and Controller. In December 1999, he was elected Senior Vice President and Chief Financial Officer. Mr. Fayard was elected Executive Vice President of the Company in February 2003.
Irial Finan, 50, is Executive Vice President of the Company and President, Bottling Investments and Supply Chain. Mr. Finan joined the Coca-Cola system in 1981 with Coca-Cola Bottlers Ireland, Ltd., where for several years he held a variety of accounting positions. From 1987 until 1990, Mr. Finan served as Finance Director of Coca-Cola Bottlers Ireland, Ltd. From 1991 to 1993, he served as Managing Director of Coca-Cola Bottlers Ulster, Ltd. He was Managing Director of Coca-Cola Bottlers in Romania and Bulgaria until late 1994. From 1995 to 1999, he served as Managing Director of Molino Beverages, with responsibility for expanding markets, including the Republic of Ireland, Northern Ireland, Romania, Moldova, Russia and Nigeria. Mr. Finan served from May 2001 until 2003 as Chief Executive Officer of Coca-Cola Hellenic. In August 2004, Mr. Finan joined the Company and was named President, Bottling Investments. He was elected Executive Vice President of the Company in October 2004.
E. Neville Isdell, 64, is Chairman of the Board of Directors and Chief Executive Officer of the Company. Mr. Isdell joined the Coca-Cola system in 1966 with the local bottling company in Zambia. In 1972, he became General Manager of Coca-Cola Bottling of Johannesburg, the largest Coca-Cola bottler in South Africa at the time.
24
Table of Contents
Mr. Isdell was named Region Manager for Australia in 1980. In 1981, he became President of Coca-Cola Bottlers Philippines, Inc., the bottling joint venture between the Company and San Miguel Corporation in the Philippines. Mr. Isdell was appointed President of the Central European Division of the Company in 1985. In January 1989, he was elected Senior Vice President of the Company and was appointed President of the Northeast Europe/Africa Group, which was renamed the Northeast Europe/Middle East Group in 1992. In 1995, Mr. Isdell was named President of the Greater Europe Group. From July 1998 to September 2000, he was Chairman and Chief Executive Officer of Coca-Cola Beverages Plc in Great Britain, where he oversaw that companys merger with Hellenic Bottling and the formation of Coca-Cola Hellenic, one of the Companys largest bottlers. Mr. Isdell served as Chief Executive Officer of Coca-Cola Hellenic from September 2000 until May 2001 and served as Vice Chairman of Coca-Cola Hellenic from May 2001 until December 2001. From January 2002 to May 2004, Mr. Isdell was an international consultant to the Company. He was elected to his current positions on June 1, 2004. In December 2007, the Company announced that Mr. Isdell will transition from the position of Chief Executive Officer of the Company, effective July 1, 2008; however, Mr. Isdell will remain Chairman of the Board of Directors until the Companys Annual Meeting of Shareowners in April 2009.
Glenn G. Jordan S., 51, is President of the Pacific Group. Mr. Jordan joined the Company in 1978 as a field representative for Coca-Cola de Colombia where, for several years, he held various positions, including Region Manager from 1985 to 1989. Mr. Jordan served as Marketing Operations Manager, Pacific Group from 1989 to 1990 and as Vice President of Coca-Cola International and Executive Assistant to the Pacific Group President from 1990 to 1991. Mr. Jordan served as Senior Vice President, Marketing and Operations, for the Brazil Division from 1991 to 1995, as President of the River Plate Division, which comprised Argentina, Uruguay and Paraguay from 1995 to 2000, and as President of the South Latin America Division, comprising Argentina, Bolivia, Chile, Ecuador, Paraguay, Peru and Uruguay from 2000 to 2003. In February 2003, Mr. Jordan was appointed Executive Vice President and Director of Operations for the Latin America Group and served in that capacity until February 2006. Mr. Jordan was appointed President of the East, South Asia and Pacific Rim Group in February 2006. The East, South Asia and Pacific Rim Group was reconfigured and renamed the Pacific Group, effective January 1, 2007.
Geoffrey J. Kelly, 63, is Senior Vice President and General Counsel of the Company. Mr. Kelly joined the Company in 1970 in Australia as manager of the Legal Department for the Australasia Area. Since then he has held a number of key roles, including Senior Counsel for the Pacific Group and subsequently for the Middle and Far East Group. In 2000, Mr. Kelly was appointed Senior Counsel for International Operations. He became Chief Deputy General Counsel in 2003 and was elected Senior Vice President of the Company in 2004. In January 2005, he assumed the role of Acting General Counsel to the Company, and in July 2005, he was elected General Counsel of the Company.
Muhtar Kent, 55, is currently President and Chief Operating Officer of the Company. In December 2007, Mr. Kent was also elected Chief Executive Officer of the Company, effective July 1, 2008, and in February 2008, he was nominated by the Board of Directors to stand for election as a Director of the Company at the Annual Meeting of Shareowners to be held on April 16, 2008. Mr. Kent joined the Company in 1978 and held a variety of marketing and operations roles throughout his career with the Company. In 1985, he was appointed General Manager of Coca-Cola Turkey and Central Asia. From 1989 to 1995, Mr. Kent served as President of the East Central Europe Division and Senior Vice President of Coca-Cola International. Between 1995 and 1998, he served as Managing Director of Coca-Cola Amatil Limited - Europe, and from 1999 until 2005, he served as President and Chief Executive Officer of Efes Beverage Group and as a board member of Coca-Cola Icecek. Mr. Kent rejoined the Company in May 2005 as President, North Asia, Eurasia and Middle East Group, was appointed President, Coca-Cola International in January 2006 and was elected Executive Vice President of the Company in February 2006. He was elected President and Chief Operating Officer of the Company in December 2006.
Robert P. Leechman, 51, is Vice President and Chief Customer and Commercial Officer of the Company. Prior to joining the Company, Mr. Leechman held various sales management positions with Mars Inc. Mr. Leechman joined the Company in 1988 as general sales manager for Coca-Cola & Schweppes Beverages in England. In 1990, he was
25
Table of Contents
appointed region sales manager for the Gulf States in the Companys Middle East Division and in 1996, he became region manager for the Gulf States. In 1998, he was appointed general manager for the Olympic Games, where he led the activation of the Coca-Cola systems sponsorship activities for the 2000 Olympic Games held in Australia. In 2001, Mr. Leechman was appointed President of the Central Europe and Russia Division, and then briefly, President of the Central Europe Division after the creation of the Companys European Union Group. He was named President, Global Customer and Commercial Leadership, Europe in September 2005. Mr. Leechman was appointed Chief Customer and Commercial Officer of the Company effective February 2007 and was elected Vice President of the Company in July 2007.
Thomas G. Mattia, 59, is Senior Vice President of the Company and Director of Worldwide Public Affairs and Communications. Prior to joining the Company, Mr. Mattia served since 2000 as Vice President of Global Communications at technology services leader EDS, where he was responsible for a wide range of activities from brand management and media relations to advertising and on-line marketing and communications. From 1995 to 2000, Mr. Mattia held a variety of executive positions with Ford Motor Company, including head of International Public Affairs, Vice President of Lincoln Mercury and Director of North American Public Affairs. Mr. Mattia was appointed Director of Worldwide Public Affairs and Communications effective January 20, 2006, and was elected Senior Vice President of the Company in February 2006.
Cynthia P. McCague, 57, is Senior Vice President of the Company and Director of Human Resources. Ms. McCague initially joined the Company in 1982, and since then has worked across the Coca-Cola business system in a variety of human resources and business roles in Europe and the United States. In 1998, she was appointed to lead the human resources function for Coca-Cola Beverages Plc in Great Britain, which in 2000 became Coca-Cola Hellenic, a large publicly traded Coca-Cola bottler. Ms. McCague rejoined the Company in June 2004 as Director of Human Resources. She was elected Senior Vice President of the Company in July 2004 and has led the global Human Resources function since that time.
Dominique Reiniche, 52, is President of the European Union Group. Ms. Reiniche joined the Company in May 2005 and was appointed to her current position at that time. Prior to joining the Company, she held a number of marketing, sales and general management positions with CCE. From May 1998 until December 2002, she served as General Manager of France for CCE, and from January 2003 until May 2005, Ms. Reiniche was President of CCE Europe. Before joining the Coca-Cola system, she was Director of Marketing and Strategy with Kraft Jacobs-Suchard.
José Octavio Reyes, 55, is President of the Latin America Group. Mr. Reyes began his career with The Coca-Cola Company in 1980 at Coca-Cola de México as Manager of Strategic Planning. In 1987, he was appointed Manager of the Sprite and Diet Coke brands at Corporate Headquarters. In 1990, he was appointed Marketing Director for the Brazil Division, and later became Marketing and Operations Vice President for the Mexico Division. Mr. Reyes assumed the role of Deputy Division President for the Mexico Division in January 1996 and was named Division President for the Mexico Division in May 1996. He assumed his position as President of the Latin America Group in December 2002.
Danny L. Strickland, 59, is Senior Vice President of the Company and Chief Innovation and Technology Officer. Mr. Strickland joined the Company in April 2003. Prior to joining the Company, Mr. Strickland served as Senior Vice President, Innovation, Technology & Quality at General Mills, Inc., from January 1997 until March 2003, where he was responsible for building a strong product pipeline, innovation culture and organization. Prior to General Mills, Mr. Strickland held several research and development, innovation, engineering, quality and strategy roles in the United States and abroad with Johnson & Johnson from March 1993 until December 1996, Kraft Foods Inc. from February 1988 until March 1993, and the Procter & Gamble Company from June 1970 until February 1988. Mr. Strickland was elected Senior Vice President of the Company in April 2003.
Joseph V. Tripodi, 52, is Senior Vice President and Chief Marketing and Commercial Officer of the Company. Prior to joining the Company, Mr. Tripodi served as Senior Vice President and Chief Marketing Officer for Allstate
26
Table of Contents
Insurance Co. Prior to joining Allstate in November 2003, Mr. Tripodi was Chief Marketing Officer for The Bank of New York. From 1999 until April 2002, he served as Chief Marketing Officer for Seagram Spirits & Wine Group. From 1989 to 1998, he was the Executive Vice President for Global Marketing, Products and Services for MasterCard International. Previously, Mr. Tripodi spent seven years with the Mobil Oil Corporation in roles of increasing responsibility in planning, marketing, business development and operations in New York, Paris, Hong Kong and Guam. Mr. Tripodi joined the Company as Chief Marketing and Commercial Officer effective September 2007 and was elected Senior Vice President of the Company in October 2007.
All executive officers serve at the pleasure of the Board of Directors. There is no family relationship between any of the Directors or executive officers of the Company.
27
Table of Contents
| ITEM 5. | MARKET FOR REGISTRANTS COMMON EQUITY, RELATED STOCKHOLDER MATTERS AND ISSUER PURCHASES OF EQUITY SECURITIES |
In the United States, the Companys common stock is listed and traded on the New York Stock Exchange (the principal market for our common stock) and is traded on the Boston, Chicago, National and Philadelphia stock exchanges.
The following table sets forth, for the quarterly periods indicated, the high and low sales prices per share for the Companys common stock, as reported on the New York Stock Exchange composite tape, and dividend per share information:
| Common Stock Market Prices |
Dividends Declared |
||||||||
| High | Low | ||||||||
| 2007 |
|||||||||
| Fourth quarter |
$ | 64.32 | $ | 56.92 | $ | 0.34 | |||
| Third quarter |
57.78 | 51.79 | 0.34 | ||||||
| Second quarter |
53.65 | 48.05 | 0.34 | ||||||
| First quarter |
49.00 | 45.56 | 0.34 | ||||||
| 2006 |
|||||||||
| Fourth quarter |
$ | 49.35 | $ | 43.72 | $ | 0.31 | |||
| Third quarter |
45.40 | 42.37 | 0.31 | ||||||
| Second quarter |
44.76 | 40.86 | 0.31 | ||||||
| First quarter |
42.99 | 39.36 | 0.31 | ||||||
While we have historically paid dividends to holders of our common stock, the declaration and payment of future dividends will depend on many factors, including our earnings, financial condition, business development needs and regulatory considerations, and is at the discretion of our Board of Directors.
As of February 22, 2008, there were approximately 305,630 shareowner accounts of record. This figure does not include a substantially greater number of street name holders or beneficial holders of our common stock, whose shares are held of record by banks, brokers and other financial institutions.
The information under the principal heading EQUITY COMPENSATION PLAN INFORMATION in the Companys definitive Proxy Statement for the Annual Meeting of Shareowners to be held on April 16, 2008, to be filed with the Securities and Exchange Commission (the Companys 2008 Proxy Statement), is incorporated herein by reference.
During the fiscal year ended December 31, 2007, no equity securities of the Company were sold by the Company that were not registered under the Securities Act of 1933, as amended.
28
Table of Contents
The following table presents information with respect to purchases of common stock of the Company made during the three months ended December 31, 2007, by the Company or any affiliated purchaser of the Company as defined in Rule 10b-18(a)(3) under the Exchange Act.
| Period | Total Number of Shares Purchased1 |
Average Price Paid Per Share |
Total Number of Shares Purchased as Part of Publicly Announced Plans or Programs2 |
Maximum Number of Shares That May Yet Be Purchased Under the Publicly Announced Plans or Programs |
|||||
| September 29, 2007 through October 26, 2007 |
200,000 | $ | 60.47 | 200,000 | 240,676,211 | ||||
| October 27, 2007 through November 23, 2007 |
900,000 | $ | 61.48 | 900,000 | 239,776,211 | ||||
| November 24, 2007 through December 31, 2007 |
780,000 | $ | 62.86 | 780,000 | 238,996,211 | ||||
| Total |
1,880,000 | $ | 61.95 | 1,880,000 | |||||
| 1 |
The total number of shares purchased includes: (i) shares purchased pursuant to the 2006 Plan described in footnote 2 below; and (ii) shares surrendered to the Company to pay the exercise price and/or to satisfy tax withholding obligations in connection with so-called stock swap exercises of employee stock options and/or the vesting of restricted stock issued to employees, of which there were none for the periods indicated in the table. |
| 2 |
On July 20, 2006, we publicly announced that our Board of Directors had authorized a plan (the 2006 Plan) for the Company to purchase up to 300 million shares of our Companys common stock. This column discloses the number of shares purchased pursuant to the 2006 Plan during the indicated time periods. |
29
Table of Contents
Performance Graph
Comparison of Five-Year Cumulative Total Return Among
The Coca-Cola Company, the Peer Group Index and the S&P 500 Index
Total Return
Stock Price Plus Reinvested Dividends
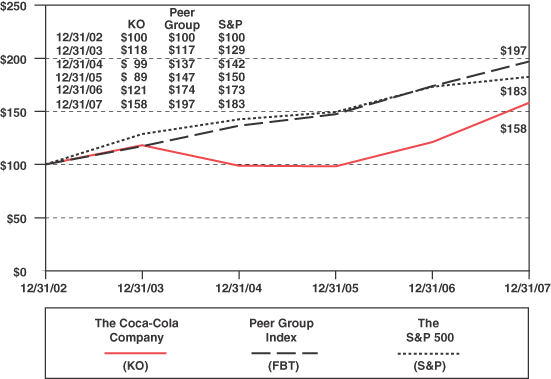
The total return assumes that dividends were reinvested quarterly and is based on a $100 investment on December 31, 2002.
The Peer Group Index is a self-constructed peer group of companies included in the Food, Beverage and Tobacco Groups of companies as published in The Wall Street Journal, from which the Company has been excluded.
The Peer Group Index consists of the following companies: Altria Group, Inc., Anheuser-Busch Companies, Inc., Archer-Daniels-Midland Company, Brown-Forman Corporation (Class B Stock), Bunge Limited, Campbell Soup Company, Loews Corporation (Carolina Group tracking stock), Chiquita Brands International, Inc., Coca-Cola Enterprises Inc., ConAgra Foods, Inc., Constellation Brands, Inc., Corn Products International, Inc., Dean Foods Company, Del Monte Foods Company, Flowers Foods, Inc., General Mills, Inc., Hansen Natural Corporation, Herbalife Ltd., H.J. Heinz Company, Hormel Foods Corporation, Kellogg Company, Kraft Foods Inc., Lancaster Colony Corporation, Martek Biosciences Corporation, McCormick & Company, Incorporated, Molson Coors Brewing Company, NBTY, Inc., Nu Skin Enterprises, Inc., Nutrisystem, Inc., PepsiAmericas, Inc., PepsiCo, Inc., Pilgrims Pride Corporation, Ralcorp Holdings, Inc., Reynolds American Inc., Sara Lee Corporation, Smithfield Foods, Inc., The Hain Celestial Group, Inc., The Hershey Company, The J.M. Smucker Company, The Pepsi Bottling Group, Inc., Tootsie Roll Industries, Inc., TreeHouse Foods, Inc., Tyson Foods, Inc., Universal Corporation, UST Inc., Weight Watchers International, Inc., and Wm. Wrigley Jr. Company.
The Wall Street Journal periodically changes the companies reported as a part of the Food, Beverage and Tobacco Groups of companies. This year, the Groups include Pilgrims Pride Corporation, which was not included in the Groups last year.
30
Table of Contents
ITEM 6. SELECTED FINANCIAL DATA
The following selected financial data should be read in conjunction with Item 7. Managements Discussion and Analysis of Financial Condition and Results of Operations and consolidated financial statements and notes thereto contained in Item 8. Financial Statements and Supplementary Data of this report.
| Year Ended December 31, | 20071 | 20062 | 20053 | 20043,4 | 2003 | |||||||||||||
| (In millions except per share data) | ||||||||||||||||||
| SUMMARY OF OPERATIONS |
||||||||||||||||||
| Net operating revenues |
$ | 28,857 | $ | 24,088 | $ | 23,104 | $ | 21,742 | $ | 20,857 | ||||||||
| Cost of goods sold |
10,406 | 8,164 | 8,195 | 7,674 | 7,776 | |||||||||||||
| Gross profit |
18,451 | 15,924 | 14,909 | 14,068 | 13,081 | |||||||||||||
| Selling, general and administrative expenses |
10,945 | 9,431 | 8,739 | 7,890 | 7,287 | |||||||||||||
| Other operating charges |
254 | 185 | 85 | 480 | 573 | |||||||||||||
| Operating income |
7,252 | 6,308 | 6,085 | 5,698 | 5,221 | |||||||||||||
| Interest income |
236 | 193 | 235 | 157 | 176 | |||||||||||||
| Interest expense |
456 | 220 | 240 | 196 | 178 | |||||||||||||
| Equity incomenet |
668 | 102 | 680 | 621 | 406 | |||||||||||||
| Other income (loss)net |
173 | 195 | (93 | ) | (82 | ) | (138 | ) | ||||||||||
| Gains on issuances of stock by equity investees |
| | 23 | 24 | 8 | |||||||||||||
| Income before income taxes |
7,873 | 6,578 | 6,690 | 6,222 | 5,495 | |||||||||||||
| Income taxes |
1,892 | 1,498 | 1,818 | 1,375 | 1,148 | |||||||||||||
| Net income |
$ | 5,981 | $ | 5,080 | $ | 4,872 | $ | 4,847 | $ | 4,347 | ||||||||
| Average shares outstanding |
2,313 | 2,348 | 2,392 | 2,426 | 2,459 | |||||||||||||
| Average shares outstanding assuming dilution |
2,331 | 2,350 | 2,393 | 2,429 | 2,462 | |||||||||||||
| PER SHARE DATA |
||||||||||||||||||
| Basic net income |
$ | 2.59 | $ | 2.16 | $ | 2.04 | $ | 2.00 | $ | 1.77 | ||||||||
| Diluted net income |
2.57 | 2.16 | 2.04 | 2.00 | 1.77 | |||||||||||||
| Cash dividends |
1.36 | 1.24 | 1.12 | 1.00 | 0.88 | |||||||||||||
| Closing market price on December 31 |
61.37 | 48.25 | 40.31 | 41.64 | 50.75 | |||||||||||||
| TOTAL MARKET VALUE OF COMMON STOCK |
$ | 142,289 | $ | 111,857 | $ | 95,504 | $ | 100,325 | $ | 123,908 | ||||||||
| BALANCE SHEET DATA |
||||||||||||||||||
| Cash, cash equivalents and current marketable securities |
$ | 4,308 | $ | 2,590 | $ | 4,767 | $ | 6,768 | $ | 3,482 | ||||||||
| Property, plant and equipmentnet |
8,493 | 6,903 | 5,831 | 6,091 | 6,097 | |||||||||||||
| Depreciation |
958 | 763 | 752 | 715 | 667 | |||||||||||||
| Capital expenditures |
1,648 | 1,407 | 899 | 755 | 812 | |||||||||||||
| Total assets |
43,269 | 29,963 | 29,427 | 31,441 | 27,410 | |||||||||||||
| Long-term debt |
3,277 | 1,314 | 1,154 | 1,157 | 2,517 | |||||||||||||
| Shareowners equity |
21,744 | 16,920 | 16,355 | 15,935 | 14,090 | |||||||||||||
| NET CASH PROVIDED BY OPERATING ACTIVITIES |
$ | 7,150 | $ | 5,957 | $ | 6,423 | $ | 5,968 | $ | 5,456 | ||||||||
Certain prior year amounts have been reclassified to conform to the current year presentation.
| 1 |
In 2007, we adopted FASB Interpretation No. 48, Accounting for Uncertainty in Income Taxes and recorded an approximate $65 million increase in accrued income taxes in our consolidated balance sheet for unrecognized tax benefits, which was accounted for as a cumulative effect adjustment to the January 1, 2007 balance of reinvested earnings. |
| 2 |
In 2006, we adopted Statement of Financial Accounting Standards (SFAS) No. 158, Employers Accounting for Defined Benefit Pension and Other Postretirement Plansan amendment of FASB Statements No. 87, 88, 106, and 132(R). |
| 3 |
We adopted FASB Staff Position (FSP) No. 109-2, Accounting and Disclosure Guidance for the Foreign Earnings Repatriation Provision within the American Jobs Creation Act of 2004 in 2004. FSP No. 109-2 allowed the Company to record the tax expense associated with the repatriation of foreign earnings in 2005 when the previously unremitted foreign earnings were actually repatriated. |
| 4 |
We adopted Interpretation No. 46(R), Consolidation of Variable Interest Entities, effective April 2, 2004. |
31
Table of Contents
| ITEM 7. | MANAGEMENTS DISCUSSION AND ANALYSIS OF FINANCIAL CONDITION AND RESULTS OF OPERATIONS |
Overview
The following Managements Discussion and Analysis of Financial Condition and Results of Operations (MD&A) is intended to help the reader understand The Coca-Cola Company, our operations and our present business environment. MD&A is provided as a supplement toand should be read in conjunction withour consolidated financial statements and the accompanying notes thereto contained in Item 8. Financial Statements and Supplementary Data of this report. This overview summarizes the MD&A, which includes the following sections:
| | Our Businessa general description of our business and the nonalcoholic beverages segment of the commercial beverages industry, our objective, our strategic priorities, our core capabilities, and challenges and risks of our business. |
| | Critical Accounting Policies and Estimatesa discussion of accounting policies that require critical judgments and estimates. |
| | Operations Reviewan analysis of our Companys consolidated results of operations for the three years presented in our consolidated financial statements. Except to the extent that differences among our operating segments are material to an understanding of our business as a whole, we present the discussion in the MD&A on a consolidated basis. |
| | Liquidity, Capital Resources and Financial Positionan analysis of cash flows; off-balance sheet arrangements and aggregate contractual obligations; foreign exchange; an overview of financial position; and the impact of inflation and changing prices. |
Our Business
General
We are the largest manufacturer, distributor and marketer of nonalcoholic beverage concentrates and syrups in the world. Along with Coca-Cola, which is recognized as the worlds most valuable brand, we market four of the worlds top five nonalcoholic sparkling brands, including Diet Coke, Fanta and Sprite. Our Company owns or licenses more than 450 brands, including diet and light beverages, waters, enhanced waters, juices and juice drinks, teas, coffees, and energy and sports drinks. Through the worlds largest beverage distribution system, consumers in more than 200 countries enjoy the Companys beverages at a rate of approximately 1.5 billion servings each day. Our Company generates revenues, income and cash flows by selling beverage concentrates and syrups as well as finished beverages. We generally sell these products to bottling and canning operations, fountain wholesalers and some fountain retailers, and, in the case of finished products, to distributors. Our bottlers sell our branded products to businesses and institutions including retail chains, supermarkets, restaurants, small neighborhood grocers, sports and entertainment venues, and schools and colleges. We continue to expand our marketing presence and increase our unit case volume in both developed and emerging markets. Our strong and stable system helps us to capture growth by manufacturing, distributing and marketing existing, enhanced and new innovative products to our consumers throughout the world.
We have three types of bottling relationships: bottlers in which our Company has no ownership interest, bottlers in which our Company has a noncontrolling ownership interest and bottlers in which our Company has a controlling ownership interest. We authorize our bottling partners to manufacture and package products made from our concentrates and syrups into branded finished products that they then distribute and sell. In 2007, bottling partners in which our Company has no ownership interest or a noncontrolling ownership interest produced and distributed approximately 79 percent of our worldwide unit case volume.
32
Table of Contents
We make significant marketing expenditures in support of our brands, including expenditures for advertising, sponsorship fees and special promotional events. As part of our marketing activities, we, at our discretion, provide retailers and distributors with promotions and point-of-sale displays; our bottling partners with advertising support and funds designated for the purchase of cold-drink equipment; and our consumers with coupons, discounts and promotional incentives. These marketing expenditures help to enhance awareness of and increase consumer preference for our brands. We believe that greater awareness and preference promote long-term growth in unit case volume, per capita consumption and our share of worldwide nonalcoholic beverage sales.
The Nonalcoholic Beverages Segment of the Commercial Beverages Industry
We operate in the highly competitive nonalcoholic beverages segment of the commercial beverages industry. We face strong competition from numerous other general and specialty beverage companies. We, along with other beverage companies, are affected by a number of factors, including, but not limited to, cost to manufacture and distribute products, consumer spending, economic conditions, availability and quality of water, consumer preferences, inflation, political climate, local and national laws and regulations, foreign currency exchange fluctuations, fuel prices and weather patterns.
Our Objective
Our objective is to use our formidable assetsbrands, financial strength, unrivaled distribution system, global reach, and a strong commitment by our management and associates worldwideto achieve long-term sustainable growth. Our vision for sustainable growth includes the following:
| | People: Being a great place to work where people are inspired to be the best they can be. |
| | Portfolio: Bringing to the world a portfolio of beverage brands that anticipates and satisfies peoples desires and needs. |
| | Partners: Nurturing a winning network of partners and building mutual loyalty. |
| | Planet: Being a responsible global citizen that makes a difference. |
| | Profit: Maximizing return to shareowners while being mindful of our overall responsibilities. |
Strategic Priorities
We have five strategic priorities designed to create long-term sustainable growth for our Company and the Coca-Cola system and value for our shareowners. These strategic priorities are growing sparkling beverage leadership; rapidly growing still beverages; leveraging a balanced geographic portfolio; accelerating the innovation pipeline; and strengthening Coca-Cola system capability. To enable the entire Coca-Cola system so that we can deliver on these strategic priorities, we must further enhance our core capabilities of consumer marketing; commercial leadership; and franchise leadership.
Core Capabilities
Consumer Marketing
Marketing investments are designed to enhance consumer awareness and increase consumer preference for our brands. This produces long-term growth in unit case volume, per capita consumption and our share of worldwide nonalcoholic beverage sales. We heighten consumer awareness of and product appeal for our brands using integrated marketing programs. Through our relationships with our bottling partners and those who sell our products in the marketplace, we create and implement marketing programs both globally and locally. In developing a strategy for a Company brand, we conduct product and packaging research, establish brand positioning, develop precise consumer communications and solicit consumer feedback. Our integrated global and local marketing programs include activities such as advertising, point-of-sale merchandising and sales promotions.
33
Table of Contents
Commercial Leadership
The Coca-Cola system has millions of customers around the world who sell or serve our products directly to consumers. We focus on enhancing value for our customers and providing solutions to grow their beverage businesses. Our approach includes understanding each customers business and needs, whether that customer is a sophisticated retailer in a developed market or a kiosk owner in an emerging market. We focus on ensuring that our customers have the right product and package offerings and the right promotional tools to deliver enhanced value to themselves and the Company. We are constantly looking to build new beverage consumption occasions in our customers outlets through unique and innovative consumer experiences, product availability and delivery systems, and beverage merchandising and displays.
Franchise Leadership
We must continue to improve our franchise leadership capabilities to give our Company and our bottling partners the ability to grow together through shared values, aligned incentives and a sense of urgency and flexibility that supports consumers always changing needs and tastes. The financial health and success of our bottling partners are critical components of the Companys success. We work with our bottling partners to continuously look for ways to improve system economics, and we share best practices throughout the bottling system. We also design business models for still beverages in specific markets to ensure that we appropriately share the value created by these beverages with our bottling partners. We will continue to build a supply chain network that leverages the size and scale of the Coca-Cola system to gain a competitive advantage.
Challenges and Risks
Being a global company provides unique opportunities for our Company. Challenges and risks accompany those opportunities.
Our management has identified certain challenges and risks that demand the attention of the nonalcoholic beverages segment of the commercial beverages industry and our Company. Of these, four key challenges and risks are discussed below.
Obesity and Inactive Lifestyles. Increasing awareness among consumers, public health professionals and government agencies of the potential health problems associated with obesity and inactive lifestyles represents a significant challenge to our industry. We recognize that obesity is a complex public health problem. Our commitment to consumers begins with our broad product line, which includes a wide selection of diet and light beverages, juices and juice drinks, sports drinks and water products. Our commitment also includes adhering to responsible policies in schools and in the marketplace; supporting programs to encourage physical activity and promote nutrition education; and continuously meeting changing consumer needs through beverage innovation, choice and variety. We are committed to playing an appropriate role in helping address this issue in cooperation with governments, educators and consumers through science-based solutions and programs.
Water Quality and Quantity. Water quality and quantity is an issue that increasingly requires our Companys attention and collaboration with the nonalcoholic beverages segment of the commercial beverages industry, governments, nongovernmental organizations and communities where we operate. Water is the main ingredient in substantially all of our products. It is also a limited natural resource facing unprecedented challenges from overexploitation, increasing pollution and poor management. Our Company is in an excellent position to share the water-related knowledge we have developed in the communities we servewater-resource management, water treatment, wastewater treatment systems, and models for working with communities and partners in addressing water and sanitation needs. We are actively engaged in assessing the specific water-related risks that we and many of our bottling partners face and have implemented a formal water risk management program. We are working with our global partners to develop water sustainability projects. We are actively encouraging improved water efficiency and conservation efforts throughout our system. As demand for water continues to increase around the world, we expect commitment and continued action on our part will be crucial in the successful long-term stewardship of this critical natural resource.
34
Table of Contents
Evolving Consumer Preferences. Consumers want more choices. We are impacted by shifting consumer demographics and needs, on-the-go lifestyles, aging populations in developed markets and consumers who are empowered with more information than ever. We are committed to generating new avenues for growth through our core brands with a focus on diet and light products. We are also committed to continuing to expand the variety of choices we provide to consumers to meet their needs, desires and lifestyle choices.
Increased Competition and Capabilities in the Marketplace. Our Company is facing strong competition from some well-established global companies and many local participants. We must continue to selectively expand into other profitable segments of the nonalcoholic beverages segment of the commercial beverages industry and strengthen our capabilities in marketing and innovation in order to maintain our brand loyalty and market share.
All four of these challenges and risksobesity and inactive lifestyles, water quality and quantity, evolving consumer preferences, and increased competition and capabilities in the marketplacehave the potential to have a material adverse effect on the nonalcoholic beverages segment of the commercial beverages industry and on our Company; however, we believe our Company is well positioned to appropriately address these challenges and risks.
See also Item 1A. Risk Factors in Part I of this report for additional information about risks and uncertainties facing our Company.
Critical Accounting Policies and Estimates
Our consolidated financial statements are prepared in accordance with generally accepted accounting principles in the United States, which require management to make estimates, judgments and assumptions that affect the amounts reported in the consolidated financial statements and accompanying notes. We believe that our most critical accounting policies and estimates relate to the following:
| | Basis of Presentation and Consolidation |
| | Recoverability of Noncurrent Assets |
| | Revenue Recognition |
| | Income Taxes |
| | Contingencies |
Management has discussed the development, selection and disclosure of critical accounting policies and estimates with the Audit Committee of the Companys Board of Directors. While our estimates and assumptions are based on our knowledge of current events and actions we may undertake in the future, actual results may ultimately differ from these estimates and assumptions. For a discussion of the Companys significant accounting policies, refer to Note 1 of Notes to Consolidated Financial Statements.
Basis of Presentation and Consolidation
Our Company consolidates all entities that we control by ownership of a majority voting interest as well as variable interest entities for which our Company is the primary beneficiary. Our judgment in determining if we are the primary beneficiary of the variable interest entities includes assessing our Companys level of involvement in setting up the entity, determining if the activities of the entity are substantially conducted on behalf of our Company, determining whether the Company provides more than half of the subordinated financial support to the entity, and determining if we absorb the majority of the entitys expected losses or returns.
We use the equity method to account for investments for which we have the ability to exercise significant influence over operating and financial policies of the investee. Our consolidated net income includes our Companys proportionate share of the net income or loss of these companies. Our judgment regarding the level of influence over
35
Table of Contents
each equity method investment includes considering key factors such as our ownership interest, representation on the board of directors, participation in policy-making decisions and material intercompany transactions.
We use the cost method to account for investments in companies that we do not control and for which we do not have the ability to exercise significant influence over operating and financial policies. In accordance with the cost method, these investments are recorded at cost or fair value, as appropriate. We record dividend income when applicable dividends are declared.
Our Company eliminates all significant intercompany transactions, including the intercompany portion of transactions with equity method investees, from our financial results.
Recoverability of Noncurrent Assets
Managements assessments of the recoverability of noncurrent assets involve critical accounting estimates. These assessments reflect managements best assumptions, which, we believe, are consistent with the assumptions that hypothetical marketplace participants would use. Factors that management must estimate when performing recoverability and impairment tests include, among others, the economic life of the asset, sales volume, prices, inflation, cost of capital, marketing spending, foreign currency exchange rates, tax rates and capital spending. These factors are often interdependent and therefore do not change in isolation. These factors include inherent uncertainties, and significant management judgment is involved in estimating their impact. However, the assumptions we use for financial reporting purposes are consistent with those we use in our internal planning, and we believe they are consistent with those that a hypothetical marketplace participant would use. Management periodically evaluates and updates the estimates based on the conditions that influence these factors. The variability of these factors depends on a number of conditions, including uncertainty about future events, and thus our accounting estimates may change from period to period. If other assumptions and estimates had been used in the current period, the balances for noncurrent assets could have been materially impacted. Furthermore, if management uses different assumptions or if different conditions occur in future periods, future operating results could be materially impacted.
Our Company faces many uncertainties and risks related to various economic, political and regulatory environments in the countries in which we operate, particularly in developing or emerging markets. Refer to the heading Our BusinessChallenges and Risks, above, and Item 1A. Risk Factors in Part I of this report. As a result, management must make numerous assumptions which involve a significant amount of judgment when determining the recoverability of noncurrent assets in various regions around the world.
36
Table of Contents
For the noncurrent assets listed in the table below, we perform tests of impairment as appropriate. For applicable assets, we perform these tests when certain conditions exist that indicate the carrying value may not be recoverable. For other applicable assets, we perform these tests at least annually or more frequently if events or circumstances indicate that an asset may be impaired:
| December 31, 2007 | Carrying Value |
Percentage of Total Assets |
||||
| (In millions except percentages) | ||||||
| Tested for impairment when conditions indicate carrying value may be impaired: |
||||||
| Equity method investments |
$ | 7,289 | 17 | % | ||
| Cost method investments, principally bottling companies |
488 | 1 | ||||
| Other assets |
2,675 | 6 | ||||
| Property, plant and equipment, net |
8,493 | 20 | ||||
| Amortized intangible assets, net |
493 | 1 | ||||
| Total |
$ | 19,438 | 45 | % | ||
| Tested for impairment at least annually or when events indicate that an asset may be impaired: |
||||||
| Trademarks with indefinite lives |
$ | 5,153 | 12 | % | ||
| Goodwill |
4,256 | 10 | ||||
| Bottlers franchise rights |
2,184 | 5 | ||||
| Other intangible assets not subject to amortization |
133 | | ||||
| Total |
$ | 11,726 | 27 | % | ||
During 2007, operating losses incurred in several quarters by certain consolidated bottling operations in Asia and Europe were considered impairment indicators. Therefore, the Company completed impairment reviews of our noncurrent assets in these bottling operations. In 2007, as a result of these impairment reviews, the Company did not record any impairment charges related to these bottling operations. As of December 31, 2007, the remaining carrying values of our noncurrent assets in bottling operations subject to these impairment reviews in Asia and Europe were approximately $386 million and $2,829 million, respectively. The Company will continue to monitor the recoverability of these noncurrent assets and investments in bottling operations in 2008.
Equity Method and Cost Method Investments
We review our equity and cost method investments in every reporting period to determine whether a significant event or change in circumstances has occurred that may have an adverse effect on the fair value of each investment. When such events or changes occur, we evaluate the fair value compared to the carrying value of the related investment. We also perform this evaluation every reporting period for each investment for which the carrying value has exceeded the fair value in the prior period. The fair values of most of our Companys investments in publicly traded companies are often readily available based on quoted market prices. For investments in nonpublicly traded companies, managements assessment of fair value is based on valuation methodologies including discounted cash flows, estimates of sales proceeds and appraisals, as appropriate. We consider the assumptions that we believe hypothetical marketplace participants would use in evaluating estimated future cash flows when employing the discounted cash flow or estimates of sales proceeds valuation methodologies. The ability to accurately predict future cash flows, especially in developing and unstable markets, may impact the determination of fair value.
In the event a decline in fair value of an investment occurs, management may be required to determine if the decline in fair value is other than temporary. Managements assessment as to the nature of a decline in fair value is based on the valuation methodologies discussed above, our ability and intent to hold the investment, and whether evidence indicating the cost of the investment is recoverable within a reasonable period of time outweighs evidence to the contrary. We consider most of our equity method investees to be strategic long-term investments. If the fair value of
37
Table of Contents
an investment is less than its carrying value and the decline in value is considered to be other than temporary, a write-down is recorded. Managements assessments of fair value represent our best estimates as of the time of the impairment review and are consistent with the assumptions that we believe hypothetical marketplace participants would use. If different assessments were made, this could have a material impact on our consolidated financial statements.
The following table presents the difference between calculated fair values, based on quoted closing prices of publicly traded shares, and our Companys carrying values for significant investments in publicly traded bottlers accounted for as equity method investees (in millions):
| December 31, 2007 | Fair Value |
Carrying Value |
Difference | ||||||
| Coca-Cola Enterprises Inc. |
$ | 4,398 | $ | 1,637 | $ | 2,761 | |||
| Coca-Cola Hellenic Bottling Company S.A. |
3,647 | 1,549 | 2,098 | ||||||
| Coca-Cola FEMSA, S.A.B. de C.V. |
2,853 | 996 | 1,857 | ||||||
| Coca-Cola Amatil Limited |
1,860 | 806 | 1,054 | ||||||
| Coca-Cola Icecek A.S. |
578 | 156 | 422 | ||||||
| Grupo Continental, S.A. |
369 | 176 | 193 | ||||||
| Coca-Cola Embonor S.A. |
271 | 208 | 63 | ||||||
| Coca-Cola Bottling Company Consolidated |
146 | 73 | 73 | ||||||
| Embotelladoras Polar S.A. |
115 | 67 | 48 | ||||||
| $ | 14,237 | $ | 5,668 | $ | 8,569 | ||||
Other Assets
Our Company invests in infrastructure programs with our bottlers that are directed at strengthening our bottling system and increasing unit case volume. Additionally, our Company advances payments to certain customers to fund future marketing activities intended to generate profitable volume and expenses such payments over the periods benefited. Advance payments are also made to certain customers for distribution rights. Payments under these programs are generally capitalized and reported as other assets in our consolidated balance sheets. When facts and circumstances indicate that the carrying value of these assets may not be recoverable, management evaluates the recoverability of the carrying value of these assets by preparing estimates of sales volume and the resulting gross profit and cash flows. If the carrying value of these assets is assessed to be recoverable, it is amortized over the periods benefited. If the carrying value of these assets is considered to be not recoverable, an impairment is recognized, resulting in a write-down of assets.
Property, Plant and Equipment
Certain events or changes in circumstances may indicate that the recoverability of the carrying amount of property, plant and equipment should be assessed. Such events or changes may include a significant decrease in market value, a significant change in the business climate in a particular market, or a current-period operating or cash flow loss combined with historical losses or projected future losses. If an event occurs or changes in circumstances are present, we estimate the future cash flows expected to result from the use of the asset and its eventual disposition. If the sum of the expected future cash flows (undiscounted and without interest charges) is less than the carrying amount, we recognize an impairment loss. The impairment loss recognized is the amount by which the carrying amount exceeds the fair value. We use a variety of methodologies to determine the fair value of property, plant and equipment, including appraisals and cash flow analyses, that are consistent with the assumptions we believe hypothetical marketplace participants would use.
In 2007, our Company recorded a charge of approximately $99 million in the line item equity incomenet resulting from the impact of our proportionate share of asset write-downs primarily related to excess and obsolete bottles and cases at CCBPI, which impacted Bottling Investments. Refer to the heading Operations ReviewEquity IncomeNet and Note 3 of Notes to Consolidated Financial Statements.
38
Table of Contents
Goodwill, Trademarks and Other Intangible Assets
SFAS No. 142, Goodwill and Other Intangible Assets, classifies intangible assets into three categories: (1) intangible assets with definite lives subject to amortization; (2) intangible assets with indefinite lives not subject to amortization; and (3) goodwill. For intangible assets with definite lives, tests for impairment must be performed if conditions exist that indicate the carrying value may not be recoverable. For intangible assets with indefinite lives and goodwill, tests for impairment must be performed at least annually or more frequently if events or circumstances indicate that assets might be impaired. Our equity method investees also perform such tests for impairment for intangible assets and/or goodwill. If an impairment charge was recorded by one of our equity method investees, the Company would record its proportionate share of such charge.
In 2006, our Company recorded a charge of approximately $602 million in the line item equity incomenet resulting from the impact of our proportionate share of an impairment charge recorded by CCE, which impacted Bottling Investments. Refer to the heading Operations ReviewEquity IncomeNet and Note 3 of Notes to Consolidated Financial Statements.
Our trademarks and other intangible assets determined to have definite lives are amortized over their useful lives. In accordance with SFAS No. 142, if conditions exist that indicate the carrying value may not be recoverable, we review such trademarks and other intangible assets with definite lives for impairment. Such conditions may include an economic downturn in a market or a change in the assessment of future operations. Trademarks and other intangible assets determined to have indefinite useful lives are not amortized. We test such trademarks and other intangible assets with indefinite useful lives for impairment annually, or more frequently if events or circumstances indicate that assets might be impaired. Goodwill is not amortized. We also perform tests for impairment of goodwill annually, or more frequently if events or circumstances indicate it might be impaired. All goodwill is assigned to reporting units, which are one level below our operating segments. Goodwill is assigned to the reporting unit that benefits from the synergies arising from each business combination. We perform our impairment tests of goodwill at our reporting unit level. Impairment tests for goodwill include comparing the fair value of the respective reporting unit with its carrying value, including goodwill. We use a variety of methodologies in conducting these impairment assessments, including cash flow analyses that are consistent with the assumptions we believe hypothetical marketplace participants would use, estimates of sales proceeds and appraisals. Where applicable, we use an appropriate discount rate that is commensurate with the risk inherent in the projected cash flows.
In 2006, our Company recorded impairment charges of approximately $41 million primarily related to trademarks for beverages sold in the Philippines and Indonesia. The Philippines and Indonesia are components of the Pacific. The amount of these impairment charges was determined by comparing the fair values of the intangible assets to their respective carrying values. The fair values were determined using discounted cash flow analyses. Because the fair values were less than the carrying values of the assets, we recorded impairment charges to reduce the carrying values of the assets to their respective fair values. These impairment charges were recorded in the line item other operating charges in the consolidated statement of income.
In 2005, our Company recorded impairment charges of approximately $84 million related to intangible assets. These intangible assets were related to trademarks for beverages sold in the Philippines. The carrying value of our trademarks in the Philippines, prior to the recording of the impairment charges in 2005, was approximately $268 million. The impairments were the result of our revised outlook for the Philippines, which had been unfavorably impacted by declines in volume and income before income taxes resulting from the continued lack of an affordable package offering and the continued limited availability of these trademark beverages in the marketplace. We determined the amounts of the impairment charges by comparing the fair values of the intangible assets to their then carrying values. Fair values were derived using discounted cash flow analyses with a number of scenarios that were weighted based on the probability of different outcomes. Because the fair values were less than the carrying values of the assets, we recorded impairment charges to reduce the carrying values of the assets to fair values. In addition, in 2005, we recorded an impairment charge of approximately $4 million in the line item equity incomenet related to our proportionate share of a write-down of intangible assets recorded by our equity method investee bottler in the Philippines.
39
Table of Contents
Revenue Recognition
We recognize revenue when persuasive evidence of an arrangement exists, delivery of products has occurred, the sales price is fixed or determinable, and collectibility is reasonably assured. For our Company, this generally means that we recognize revenue when title to our products is transferred to our bottling partners, resellers or other customers. In particular, title usually transfers upon shipment to or receipt at our customers locations, as determined by the specific sales terms of each transaction. Our sales terms do not allow for a right of return except for matters related to any manufacturing defects on our part.
In addition, our customers can earn certain incentives, which are included in deductions from revenue, a component of net operating revenues in the consolidated statements of income. These incentives include, but are not limited to, cash discounts, funds for promotional and marketing activities, volume-based incentive programs and support for infrastructure programs. Refer to Note 1 of Notes to Consolidated Financial Statements. The aggregate deductions from revenue recorded by the Company in relation to these programs, including amortization expense on infrastructure programs, was approximately $4.1 billion, $3.8 billion and $3.7 billion for the years ended December 31, 2007, 2006 and 2005, respectively.
Income Taxes
In July 2006, the FASB issued FASB Interpretation No. 48, Accounting for Uncertainty in Income Taxes (Interpretation No. 48). Interpretation No. 48 clarifies the accounting for uncertainty in income taxes recognized in an enterprises financial statements in accordance with SFAS No. 109, Accounting for Income Taxes. Interpretation No. 48 prescribes a recognition threshold and measurement attribute for the financial statement recognition and measurement of a tax position taken or expected to be taken in a tax return. Interpretation No. 48 also provides guidance on derecognition, classification, interest and penalties, accounting in interim periods, disclosure and transition. Our Company adopted the provisions of Interpretation No. 48 effective January 1, 2007. As a result of the adoption of Interpretation No. 48, we recorded an approximate $65 million increase in accrued income taxes in our consolidated balance sheet for unrecognized tax benefits, which was accounted for as a cumulative effect adjustment to the January 1, 2007 balance of reinvested earnings.
Our annual tax rate is based on our income, statutory tax rates and tax planning opportunities available to us in the various jurisdictions in which we operate. Significant judgment is required in determining our annual tax expense and in evaluating our tax positions. We establish reserves to remove some or all of the tax benefit of any of our tax positions at the time we determine that the positions become uncertain based upon one of the following: (1) the tax position is not more likely than not to be sustained, (2) the tax position is more likely than not to be sustained, but for a lesser amount, (3) the tax position is more likely than not to be sustained, but not in the financial period in which the tax position was originally taken. For purposes of evaluating whether or not a tax position is uncertain, (1) we presume the tax position will be examined by the relevant taxing authority that has full knowledge of all relevant information, (2) the technical merits of a tax position are derived from authorities such as legislation and statutes, legislative intent, regulations, rulings and case law and their applicability to the facts and circumstances of the tax position, and (3) each tax position is evaluated without considerations of the possibility of offset or aggregation with other tax positions taken. We adjust these reserves, including any impact on the related interest and penalties, in light of changing facts and circumstances, such as the progress of a tax audit.
A number of years may elapse before a particular matter for which we have established a reserve is audited and finally resolved. The number of years with open tax audits varies depending on the tax jurisdiction. The tax benefit that has been previously reserved because of a failure to meet the more likely than not recognition threshold would be recognized in our income tax expense in the first interim period when the uncertainty disappears under any one of the following conditions: (1) the tax position is more likely than not to be sustained, (2) the tax position, amount, and/or timing is ultimately settled through negotiation or litigation, or (3) the statute of limitations for the tax position has expired. Settlement of any particular issue would usually require the use of cash.
40
Table of Contents
Tax law requires items to be included in the tax return at different times than when these items are reflected in the consolidated financial statements. As a result, the annual tax rate reflected in our consolidated financial statements is different than that reported in our tax return (our cash tax rate). Some of these differences are permanent, such as expenses that are not deductible in our tax return, and some differences reverse over time, such as depreciation expense. These timing differences create deferred tax assets and liabilities. Deferred tax assets and liabilities are determined based on temporary differences between the financial reporting and tax bases of assets and liabilities. The tax rates used to determine deferred tax assets or liabilities are the enacted tax rates in effect for the year in which the differences are expected to reverse. Based on the evaluation of all available information, the Company recognizes future tax benefits, such as net operating loss carryforwards, to the extent that realizing these benefits is considered more likely than not.
We evaluate our ability to realize the tax benefits associated with deferred tax assets by analyzing our forecasted taxable income using both historical and projected future operating results, the reversal of existing temporary differences, taxable income in prior carryback years (if permitted) and the availability of tax planning strategies. A valuation allowance is required to be established unless management determines that it is more likely than not that the Company will ultimately realize the tax benefit associated with a deferred tax asset.
Additionally, undistributed earnings of a subsidiary are accounted for as a temporary difference, except that deferred tax liabilities are not recorded for undistributed earnings of a foreign subsidiary that are deemed to be indefinitely reinvested in the foreign jurisdiction. The Company has formulated a specific plan for reinvestment of undistributed earnings of its foreign subsidiaries which demonstrates that such earnings will be indefinitely reinvested in the applicable tax jurisdictions. Should we change our plans, we would be required to record a significant amount of deferred tax liabilities.
The American Jobs Creation Act of 2004 (the Jobs Creation Act) was enacted in October 2004. Among other things, it provided a one-time benefit related to foreign tax credits generated by equity investments in prior years. In 2004, the Company recorded an income tax benefit of approximately $50 million as a result of this new law. The Jobs Creation Act also included a temporary incentive for U.S. multinationals to repatriate foreign earnings at an approximate 5.25 percent effective tax rate. During 2005, the Company repatriated approximately $6.1 billion in previously unremitted foreign earnings, with an associated tax liability of approximately $315 million. The reinvestment requirements of this repatriation have been fulfilled at December 31, 2007. Refer to Note 1 and Note 17 of Notes to Consolidated Financial Statements.
The Companys effective tax rate is expected to be approximately 22.0 to 22.5 percent in 2008. This estimated tax rate does not reflect the impact of any unusual or special items that may affect our tax rate in 2008.
Contingencies
Our Company is subject to various claims and contingencies, mostly related to legal proceedings and tax matters (both income taxes and indirect taxes). Due to their nature, such legal proceedings and tax matters involve inherent uncertainties including, but not limited to, court rulings, negotiations between affected parties and governmental actions. Management assesses the probability of loss for such contingencies and accrues a liability and/or discloses the relevant circumstances, as appropriate. Management believes that any liability to the Company that may arise as a result of currently pending legal proceedings, tax matters or other contingencies will not have a material adverse effect on the financial condition of the Company taken as a whole. Refer to Note 13 of Notes to Consolidated Financial Statements.
Recent Accounting Standards and Pronouncements
Refer to Note 1 of Notes to Consolidated Financial Statements for a discussion of recent accounting standards and pronouncements.
41
Table of Contents
Operations Review
We manufacture, distribute and market nonalcoholic beverage concentrates and syrups. We also manufacture, distribute and market finished beverages. Our organizational structure as of January 1, 2007 consisted of the following operating segments, the first seven of which are sometimes referred to as operating groups or groups: Africa; Eurasia; European Union; Latin America; North America; Pacific; Bottling Investments; and Corporate. We revised previously reported group information to conform to our operating structure as of January 1, 2007. For further information regarding our operating segments, including a discussion of changes made to our operating segments effective January 1, 2007, refer to Note 21 of Notes to Consolidated Financial Statements.
Beverage Volume
We measure our sales volume in two ways: (1) unit cases of finished products and (2) concentrate sales. A unit case is a unit of measurement equal to 192 U.S. fluid ounces of finished beverage (24 eight-ounce servings). Unit case volume represents the number of unit cases of Company beverage products directly or indirectly sold by the Company and its bottling partners to customers. Unit case volume primarily consists of beverage products bearing Company trademarks. Also included in unit case volume are certain products licensed to, or distributed by, our Company, and brands owned by Coca-Cola system bottlers for which our Company provides marketing support and from the sale of which we derive economic benefit. Such products licensed to, or distributed by, our Company or owned by Coca-Cola system bottlers account for a minimal portion of total unit case volume. In addition, unit case volume includes sales by joint ventures in which the Company is a partner. Unit case volume is derived based on estimates supplied by our bottling partners and distributors. Concentrate sales volume represents the amount of concentrates, syrups, beverage bases and powders (in all cases expressed in equivalent unit cases) sold by, or used in finished beverages sold by, the Company to its bottling partners or other customers. Concentrate sales replaced the gallon sales concept beginning with the first quarter of 2007. We made this change primarily to replace equivalent gallons with equivalent unit cases as a unit of measurement for concentrates, syrups, beverage bases and powders, which better reflects how our Company conducts its operations. Most of our revenues are based on concentrate sales, a primarily wholesale activity. Unit case volume and concentrate sales growth rates are not necessarily equal during any given period. Items such as seasonality, bottlers inventory practices, supply point changes, timing of price increases, new product introductions and changes in product mix can impact unit case volume and concentrate sales and can create differences between unit case volume and concentrate sales growth rates.
Information about our volume growth by operating segment is as follows:
| Percentage Change | ||||||||||||
| 2007 vs. 2006 | 2006 vs. 2005 | |||||||||||
| Year Ended December 31, | Unit Cases1,2 | Concentrate Sales |
Unit Cases1,2 | Concentrate Sales |
||||||||
| Worldwide |
6 | % | 6 | % | 4 | % | 4 | % | ||||
| Africa |
10 | 11 | 4 | 4 | ||||||||
| Eurasia |
16 | 15 | 14 | 11 | ||||||||
| European Union |
3 | 3 | 6 | 4 | ||||||||
| Latin America |
9 | 9 | 7 | 7 | ||||||||
| North America |
(1 | ) | | | | |||||||
| Pacific |
7 | 7 | 1 | 1 | ||||||||
| Bottling Investments |
64 | N/A | 16 | N/A | ||||||||
| 1 |
Bottling Investments operating segment data reflects unit case volume growth for consolidated bottlers only. |
| 2 |
Geographic segment data reflects unit case volume growth for all bottlers in the applicable geographic areas, both consolidated and unconsolidated. |
42
Table of Contents
Unit Case Volume
Although most of our Companys revenues are not based directly on unit case volume, we believe unit case volume is one of the measures of the underlying strength of the Coca-Cola system because it measures our product trends at the consumer level. The Coca-Cola system sold approximately 22.7 billion unit cases of our products in 2007, approximately 21.4 billion unit cases in 2006, and approximately 20.6 billion unit cases in 2005.
In Africa, unit case volume increased 10 percent in 2007 compared to 2006. The increase in 2007 reflected growth across all divisions, led by growth in South Africa. South Africa unit case volume increased 13 percent in 2007, driven by strong marketing, the replenishment of trade inventory resulting from the carbon dioxide shortage in the fourth quarter of 2006, and favorable weather. Solid growth in North and West Africa, and in East and Central Africa, driven primarily by strong marketing and bottler execution, also favorably impacted the results in 2007.
In Eurasia, unit case volume grew 16 percent in 2007 versus 2006. Double-digit unit case volume growth in Russia, India, Turkey, Middle East, Eastern Europe and southern Eurasia drove the results. In India, continued investment in marketing initiatives on the quality and safety of our products and focus on improved execution by the consolidated bottling operations resulted in 14 percent unit case volume growth in 2007.
Unit case volume in the European Union increased 3 percent in 2007 compared to 2006, primarily due to growth in most key countries. The results reflected the benefits of key initiatives across the group, including Coca-Cola Zero launches and the three-cola strategy (focusing on driving unit case volume growth for Coca-Cola, Coca-Cola Zero and Diet Coke or Coca-Cola light.), The Coke Side of Life Campaign, Christmas programs and activation of the Rugby World Cup. In addition, the full-year impact of the 2006 acquisition of Apollinaris GmbH, a German premium source water brand (Apollinaris), and the 2006 joint acquisition of Fonti del Vulture S.r.l. (Fonti del Vulture), an Italian mineral water company, with Coca-Cola Hellenic contributed to unit case volume growth in 2007. Unit case volume growth in the European Union was negatively impacted by the unseasonably cool and rainy summer weather compared to 2006 and the impact of World Cup in 2006.
In Latin America, unit case volume increased 9 percent in 2007 versus 2006, including 7 percent growth in Trademark Coca-Cola, reflecting the introduction of Coca-Cola Zero during the first quarter of 2007. The acquisition of Leao Junior in Brazil also favorably impacted the unit case volume growth in 2007. Unit case volume increased 16 percent in Brazil, 6 percent in Mexico and 9 percent in Argentina in 2007 versus 2006. In December 2006, the Company and Coca-Cola FEMSA entered into an agreement to jointly acquire Jugos del Valle, the second largest producer of packaged juices, nectars and fruit-flavored beverages in Mexico and the largest producer of such products in Brazil. In July 2007, the Mexican Federal Competition Commission approved the acquisition of Jugos del Valle. The transfer of ownership was completed in November 2007. Full-year 2006 unit case volume of Jugos del Valle was approximately 117 million.
Unit case volume in North America decreased 1 percent in 2007 versus 2006, reflecting a 1 percent decline in the Foodservice and Hospitality Division due to the challenging restaurant industry environment. Unit case volume in the Retail Division was even in 2007, reflecting a 1 percent favorable impact from acquisitions primarily related to glacéau. In 2007, the Company transferred the majority of the distribution of glacéau branded products to its existing bottling system with the exception of certain regional glacéau distributors and certain channels. Refer to Note 20 of Notes to Consolidated Financial Statements. Unit case volume for glacéau beverages was 56 million unit cases in 2006. The Retail Divisions unit case volume result was unfavorably impacted by the difficult sparkling beverage industry environment and by a unit case volume decline in warehouse-delivered water resulting from the strategic decision to refocus resources behind the more profitable Dasani business. Sparkling beverage unit case volume declined 2 percent in 2007 compared to 2006, reflecting the expected difficult category environment resulting from increased retail pricing. Coca-Cola Zero unit case volume continued to increase by double digits in 2007. In 2007, both Trademark Dasani and Trademark Powerade unit case volume continued to grow. Warehouse-delivered juice unit case volume declined due to retail price increases taken to cover higher ingredient costs. This decline was partially offset by continued unit case volume growth in Trademark Odwalla and Trademark Simply juices. In February 2008, the
43
Table of Contents
Company and Honest Tea, Inc. completed an agreement resulting in the Company holding an approximate 40 percent interest in Honest Tea, Inc., the maker of organic beverages, including beverages sold under the Honest Tea trademark. Refer to Note 22 of Notes to Consolidated Financial Statements.
Unit case volume in the Pacific increased 7 percent in 2007 compared to 2006. The increase includes 18 percent growth in China, 5 percent growth in the Philippines, and 3 percent growth in Japan. The increase in unit case volume in China was led by double-digit growth in sparkling beverages, Minute Maid and Nestea. The increase in unit case volume in Japan was primarily due to growth in Trademarks Coca-Cola, Sprite, Sokenbicha and water brands. Georgia Coffee volume declined 1 percent in 2007 compared to 2006; however, as a result of success with a new marketing campaign, it returned to growth in the fourth quarter of 2007. The increase in unit case volume in the Philippines was primarily due to strong sparkling unit case volume growth reflecting the investment in key marketing initiatives, the focus on improving the route-to-market, and reshaping and streamlining the supply chain and building sales capabilities. On February 22, 2007, the Company acquired the remaining 65 percent ownership interest in Coca-Cola Bottlers Philippines, Inc. (CCBPI) held by San Miguel Corporation and two of its subsidiaries (collectively, SMC) and began to implement certain initiatives to address business performance. Refer to Note 20 of Notes to Consolidated Financial Statements.
Unit case volume for Bottling Investments increased 64 percent in 2007 versus 2006, primarily due to acquisitions of certain bottlers and unit case volume growth across the bottling group. Refer to Note 20 of Notes to Consolidated Financial Statements.
In Africa, unit case volume increased 4 percent in 2006 compared to 2005, reflecting growth across the majority of divisions, which was partially offset by a slight decline in Nigeria primarily related to affordability issues and competitive and economic pressures. The unit case volume increase in Africa was also partially offset by an industrywide temporary shortage in the supply of carbon dioxide in South Africa in the fourth quarter of 2006.
In Eurasia, unit case volume grew 14 percent in 2006 compared to 2005, led by double-digit growth in Russia and Turkey, partially offset by a 5 percent decline in India. The unit case volume growth in Russia and Turkey was the result of improving macroeconomic trends, strong bottler execution and successful marketing programs. Unit case volume in Russia also benefited from the full-year impact of the joint acquisition of Multon, a Russian juice business, compared to a partial year in 2005. The Company and Coca-Cola Hellenic jointly acquired Multon in April 2005. The decline in India was primarily due to price increases in the second half of 2005 and steps taken to drive revenue growth and improve operating and working capital efficiency. The results in India reflected high single-digit declines in sparkling beverages which were partially offset by growth in still beverages. Continued investment in marketing initiatives around the quality and safety of our products and focus on execution in the consolidated bottling operations delivered positive results during the second half of 2006, despite the renewed unfounded allegations of unsafe pesticide levels in the Companys products.
Unit case volume in the European Union increased 6 percent in 2006 compared to 2005, primarily due to solid growth across all divisions driven by successful marketing campaigns, launches of Coca-Cola Zero in nine countries and favorable weather in the second half of 2006. In addition, the acquisition of Apollinaris, and the joint acquisition of Fonti del Vulture, also known as Traficante, an Italian mineral water company, with Coca-Cola Hellenic during 2006 contributed approximately 2 percentage points of unit case volume growth in 2006. Unit case volume in Germany increased 5 percent in 2006 versus 2005, and reflected strong growth of Trademark Coca-Cola in 2006 compared to 2005. The results were driven by improved marketplace execution capabilities, the launch of Coca-Cola Zero in July 2006, increased availability in the discounter channel and generally favorable weather. The acquisition of Apollinaris also contributed to unit case volume growth in Germany. Unit case volume in Northwest Europe increased 3 percent in 2006 versus 2005 as performance stabilized. The results reflected 3 percent unit case volume growth in sparkling beverages, led by growth of Trademark Coca-Cola, and solid growth in still beverages. In addition, the successful launch of Coca-Cola Zero in Great Britain at the end of June 2006 and generally favorable weather during the second half of the year contributed to the performance. Unit case volume in Iberia increased 6 percent in 2006 versus 2005, led by strong growth in Spain.
44
Table of Contents
In Latin America, unit case volume increased 7 percent in 2006 versus 2005, primarily due to growth in sparkling beverages led by growth of Trademark Coca-Cola. This performance was seen in all key markets, especially Brazil, Mexico and Argentina. In Mexico, the increase in unit case volume was driven by strong growth in Trademark Coca-Cola. In Brazil, strong marketing and bottler execution led to unit case volume growth in sparkling beverages. In Argentina, consumer marketing activities and bottler execution drove unit case volume growth.
Unit case volume in North America was even in 2006 versus 2005. Foodservice and Hospitality unit case volume increased 1 percent in 2006, reflecting growth in all key beverage categories. Unit case volume in Retail decreased 1 percent primarily driven by weak sparkling beverage trends in the second half of 2006, declines in the warehouse-delivered water business resulting from the strategic decision to refocus resources behind the more profitable Dasani business and declines in the warehouse-delivered juice business as a result of price increases to cover higher ingredient costs. These declines in Retail were partially offset by the continued success of Dasani, Coca-Cola Zero and Powerade, as well as the introduction of Black Cherry Vanilla Coca-Cola and the national rollout of Vault.
Unit case volume in the Pacific increased 1 percent in 2006 versus 2005, primarily due to double-digit growth in China, partially offset by a double-digit decline in the Philippines and a 3 percent decline in Japan. The increase in unit case volume in China was led by significant growth in both sparkling and still beverages. The double-digit decline in the Philippines was mainly driven by the continued impact of affordability and availability issues. The decrease in unit case volume in Japan was primarily due to weakness across core brands including Trademark Coca-Cola, Georgia Coffee and our green tea brands. However, results in Japan gradually improved during 2006.
Unit case volume for Bottling Investments increased 16 percent in 2006 versus 2005, primarily due to the acquisition of Kerry Beverages Limited, which was subsequently renamed Coca-Cola China Industries Limited (CCCIL), and the acquisitions of TJC Holdings (Pty) Ltd., a South African bottling company (TJC), and Apollinaris. Unit case volume for Bottling Investments also increased due to the consolidation of Brucephil, Inc. (Brucephil), the parent company of The Philadelphia Coca-Cola Bottling Company. In the third quarter of 2006, our Company signed agreements with J. Bruce Llewellyn and Brucephil for the potential purchase of the remaining shares of Brucephil not currently owned by the Company. The agreements provide for the Companys purchase of the shares upon the election of Mr. Llewellyn or the election of the Company. Based on the terms of these agreements, the Company concluded that it must consolidate Brucephil under Interpretation No. 46(R). Brucephils financial statements were consolidated effective September 29, 2006. The acquisition of the German bottling company Bremer Erfrischungsgetraenke GmbH (Bremer) during the third quarter of 2005 also contributed to unit case volume increases in 2006, reflecting the impact of full-year unit case volume in 2006 for Bremer compared to a partial year in 2005. Refer to Note 20 of Notes to Consolidated Financial Statements. The unit case volume increase was partially offset by a decline in India.
Concentrate Sales Volume
Company-wide concentrate sales volume and unit case volume both grew 6 percent in 2007 when compared to 2006. For 2007, differences between unit case volume and concentrate sales volume growth rates for all segments were primarily due to timing of concentrate shipments.
Company-wide concentrate sales volume and unit case volume both grew 4 percent in 2006 when compared to 2005. For 2006, differences between unit case volume and concentrate sales volume growth rates for all segments were primarily due to timing of concentrate shipments. In Eurasia, unit case volume increased ahead of concentrate sales volume primarily due to inventory reductions in Russia and partially offset by the timing of concentrate sales in India. Unit case volume growth also reflected the impact of a full-year of unit case volume compared to a partial year in 2005 due to the joint acquisition of Multon with Coca-Cola Hellenic in the second quarter of 2005. The Company only reports unit case volume related to Multon, as the Company does not sell concentrates or syrups to Multon.
45
Table of Contents
Analysis of Consolidated Statements of Income
| Percent Change | ||||||||||||||||||
| Year Ended December 31, | 2007 | 2006 | 2005 | 2007 vs. 2006 | 2006 vs. 2005 | |||||||||||||
| (In millions except per share data and percentages) | ||||||||||||||||||
| NET OPERATING REVENUES |
$ | 28,857 | $ | 24,088 | $ | 23,104 | 20 | % | 4 | % | ||||||||
| Cost of goods sold |
10,406 | 8,164 | 8,195 | 27 | | |||||||||||||
| GROSS PROFIT |
18,451 | 15,924 | 14,909 | 16 | 7 | |||||||||||||
| GROSS PROFIT MARGIN |
63.9 | % | 66.1 | % | 64.5 | % | ||||||||||||
| Selling, general and administrative expenses |
10,945 | 9,431 | 8,739 | 16 | 8 | |||||||||||||
| Other operating charges |
254 | 185 | 85 | * | * | |||||||||||||
| OPERATING INCOME |
7,252 | 6,308 | 6,085 | 15 | 4 | |||||||||||||
| OPERATING MARGIN |
25.1 | % | 26.2 | % | 26.3 | % | ||||||||||||
| Interest income |
236 | 193 | 235 | 22 | (18 | ) | ||||||||||||
| Interest expense |
456 | 220 | 240 | 107 | (8 | ) | ||||||||||||
| Equity incomenet |
668 | 102 | 680 | 555 | (85 | ) | ||||||||||||
| Other income (loss)net |
173 | 195 | (93 | ) | * | * | ||||||||||||
| Gains on issuances of stock by equity investees |
| | 23 | * | * | |||||||||||||
| INCOME BEFORE INCOME TAXES |
7,873 | 6,578 | 6,690 | 20 | (2 | ) | ||||||||||||
| Income taxes |
1,892 | 1,498 | 1,818 | 26 | (18 | ) | ||||||||||||
| Effective tax rate |
24.0 | % | 22.8 | % | 27.2 | % | ||||||||||||
| NET INCOME |
$ | 5,981 | $ | 5,080 | $ | 4,872 | 18 | % | 4 | % | ||||||||
| PERCENTAGE OF NET OPERATING REVENUES |
20.7 | % | 21.1 | % | 21.1 | % | ||||||||||||
| NET INCOME PER SHARE: |
||||||||||||||||||
| Basic |
$ | 2.59 | $ | 2.16 | $ | 2.04 | 20 | % | 6 | % | ||||||||
| Diluted |
$ | 2.57 | $ | 2.16 | $ | 2.04 | 19 | % | 6 | % | ||||||||
| * | Calculation is not meaningful. |
46
Table of Contents
Net Operating Revenues
Net operating revenues increased by $4.8 billion or 20 percent in 2007 versus 2006. Net operating revenues increased by $984 million or 4 percent in 2006 versus 2005.
The following table indicates, on a percentage basis, the estimated impact of key factors resulting in significant increases (decreases) in net operating revenues:
| Percent Change | ||||||
| Year Ended December 31, | 2007 vs. 2006 | 2006 vs. 2005 | ||||
| Increase in concentrate sales volume |
6 | % | 4 | % | ||
| Structural changes |
8 | (2 | ) | |||
| Price and product/geographic mix |
2 | 2 | ||||
| Impact of currency fluctuations versus the U.S. dollar |
4 | 0 | ||||
| Total percentage increase |
20 | % | 4 | % | ||
Refer to the heading Beverage Volume for a detailed discussion on concentrate sales volume.
Structural changes refers to acquisitions or dispositions of bottling, distribution or canning operations and consolidation or deconsolidation of bottling and distribution entities for accounting purposes. In 2007, structural changes increased net operating revenues by 8 percent compared to 2006. These structural changes included the impact of the acquisition of CCBPI in the first quarter of 2007, the acquisition of the 18 remaining German bottling and distribution operations in September 2007, the acquisition of CCCIL in the third quarter of 2006, the consolidation of Brucephil effective September 29, 2006 and the acquisition of several other individually insignificant bottling operations. Refer to Note 20 of Notes to Consolidated Financial Statements.
Price and product/geographic mix increased net operating revenues by 2 percent in 2007 versus 2006, primarily due to favorable pricing and product/package mix across the majority of the operating segments.
The favorable impact of currency fluctuations in 2007 compared to 2006 resulted from a weaker U.S. dollar versus most key currencies, especially a stronger euro, which favorably impacted the European Union and Bottling Investments, a stronger Brazilian real, which favorably impacted Latin America and Bottling Investments, and a stronger Australian dollar which favorably impacted Pacific and Bottling Investments. The favorable impact of the fluctuation in these currencies was partially offset by a weaker Japanese yen and South African rand, which unfavorably impacted the Pacific, Africa and Bottling Investments. Refer to the heading Foreign Exchange.
In 2006, structural changes decreased net operating revenues by 2 percent compared to 2005, primarily due to the change of the business model in Spain, partially offset by the acquisitions of Bremer in the third quarter of 2005, TJC in the first quarter of 2006, CCCIL in the third quarter of 2006 and the consolidation of Brucephil under Interpretation No. 46(R) effective September 29, 2006. Refer to Note 20 of Notes to Consolidated Financial Statements. Effective January 1, 2006, the Company granted our bottling partners in Spain the rights to manufacture and distribute Company trademarked products in can packages. Prior to granting these rights to our bottling partners, the Company held the manufacturing and distribution rights for these can packages in Spain. In connection with granting these rights, the Company reduced our planned future annual marketing support payments to our bottling partners in Spain. These changes resulted in a reduction of net operating revenues and cost of goods sold. This change did not materially impact gross profit for 2006. If the change had occurred as of January 1, 2005, net operating revenues for 2005 would have been reduced by approximately $779 million.
Price and product/geographic mix increased net operating revenues by 2 percent in 2006 compared to 2005, primarily due to price increases across the majority of the operating segments and improved pricing and product/package mix in Bottling Investments partially offset by an unfavorable product mix primarily in Japan.
47
Table of Contents
Information about our net operating revenues by operating segment as a percentage of Company net operating revenues is as follows:
| Year Ended December 31, | 2007 | 2006 | 2005 | ||||||
| Africa |
4.4 | % | 4.6 | % | 4.8 | % | |||
| Eurasia |
3.4 | 3.3 | 2.8 | ||||||
| European Union |
14.4 | 15.2 | 18.4 | ||||||
| Latin America |
10.6 | 10.3 | 8.9 | ||||||
| North America |
26.9 | 29.1 | 28.9 | ||||||
| Pacific |
13.9 | 16.5 | 18.0 | ||||||
| Bottling Investments |
26.2 | 20.6 | 17.8 | ||||||
| Corporate |
0.2 | 0.4 | 0.4 | ||||||
| 100.0 | % | 100.0 | % | 100.0 | % |
The percentage contribution of each operating segment has changed due to net operating revenues in certain segments growing at a faster rate compared to the other operating segments, the impact of foreign currency fluctuations, and the acquisitions and consolidations of certain bottling operations.
The size and timing of structural changes, including acquisitions or dispositions of bottling and canning operations, do not occur consistently from period to period. As a result, anticipating the impact of such events on future increases or decreases in net operating revenues (and other financial statement line items) usually is not possible. However, we expect to continue to buy and sell bottling interests in limited circumstances and, as a result, structural changes will continue to affect our consolidated financial statements in future periods.
Gross Profit
Our gross profit margin decreased to 63.9 percent in 2007 from 66.1 percent in 2006. Our gross profit margin decreased as a result of acquisitions and consolidations of certain bottling operations. Refer to the heading Beverage Volume and Note 20 of Notes to Consolidated Financial Statements. Generally, bottling and finished product operations produce higher net revenues but lower gross profit margins compared to concentrate and syrup operations. Our gross profit margins were also unfavorably impacted by increases in the cost of raw materials and freight. In 2008, we expect to see a moderation in commodity cost pressures.
Our gross profit margin increased to 66.1 percent in 2006 from 64.5 percent in 2005. Our gross margin was favorably impacted by the change in the business model in Spain, as discussed above. Other structural changes, which included the consolidation of Brucephil under Interpretation No. 46(R) in 2006, the acquisitions of CCCIL and TJC in 2006, and the acquisition of Bremer in 2005, unfavorably impacted our gross profit margin. Our gross margin in 2006 was also impacted favorably by price increases, partially offset by increases in the cost of raw materials and freight, primarily in North America, and by an unfavorable product mix, primarily in Japan. Gross profit margin in 2005 was favorably impacted by the receipt of approximately $109 million in proceeds related to a class action lawsuit settlement concerning price-fixing in the sale of high fructose corn syrup (HFCS) purchased by the Company during the years 1991 to 1995. Subsequent to the receipt of this settlement, the Company distributed approximately $62 million to certain bottlers in North America. From 1991 to 1995, the Company purchased HFCS on behalf of those bottlers. Therefore, those bottlers ultimately were entitled to a portion of the proceeds. The Companys portion of the settlement was approximately $47 million, which was recorded as a reduction of cost of goods sold and impacted Corporate. Refer to Note 19 of Notes to Consolidated Financial Statements.
48
Table of Contents
Selling, General and Administrative Expenses
The following table sets forth the significant components of selling, general and administrative expenses (in millions):
| Year Ended December 31, | 2007 | 2006 | 2005 | ||||||
| Selling expenses |
$ | 5,029 | $ | 3,924 | $ | 3,453 | |||
| Advertising expenses |
2,774 | 2,553 | 2,475 | ||||||
| General and administrative expenses |
2,829 | 2,630 | 2,487 | ||||||
| Stock-based compensation expense |
313 | 324 | 324 | ||||||
| Selling, general and administrative expenses |
$ | 10,945 | $ | 9,431 | $ | 8,739 | |||
Total selling, general and administrative expenses were approximately 16 percent higher in 2007 versus 2006. The increases were primarily related to continued investments in marketing, increased costs to drive growth in our consolidated bottling operations, including a 6 percent increase related to the acquisitions and consolidations of certain bottling operations (refer to Note 20 of Notes to Consolidated Financial Statements), increased sales and service costs for certain brand acquisitions and a 4 percent increase due to foreign currency fluctuations. Selling and advertising expenses increased 20 percent in 2007 compared to 2006, on a combined basis. The increases in selling and advertising expenses were primarily related to increased investments in marketing and innovation activities, including the reinvestment of certain general and administrative expense savings derived from productivity initiatives. Selling and advertising expenses also increased due to costs to drive growth in our consolidated bottling operations, including a 6 percent increase related to the acquisitions and consolidations of certain bottling operations and a 4 percent increase due to foreign currency fluctuations. General and administrative expenses increased 8 percent in 2007 compared to 2006, primarily due to increased costs in our consolidated bottling operations, including a 4 percent impact relating to the acquisitions and consolidations of certain bottling operations, increased costs of long-term incentive plans based on the Companys financial performance over the plan periods, and a 3 percent increase due to foreign currency fluctuations. These increases in general and administrative expenses were partially offset by expense savings generated through productivity initiatives. In February and October of 2007, the Company amended its U.S. retiree medical plan to limit the Companys exposure to increases in retiree medical costs associated with current and future retirees. Based on the materiality of the change in liability resulting from the amendments, we remeasured the assets and liabilities of the U.S. retiree medical plan effective February 28, 2007 and October 31, 2007. As a result of the amendments and remeasurements, the Company reduced its liabilities for the U.S. retiree medical plan by approximately $435 million. In accordance with SFAS No. 158, the Company also recognized the appropriate effects of the change in accumulated other comprehensive income (loss) and deferred taxes. In addition, annual net periodic benefits costs decreased by approximately $82 million compared to 2006, primarily due to changes to the U.S. retiree medical plan. This reduced expense impacted the general and administrative expenses line item. The Company anticipates receiving a similar benefit, as a result of the changes to the U.S. retiree medical plan, in each of the five years beginning January 1, 2008. Refer to Note 16.
As of December 31, 2007, we had approximately $441 million of total unrecognized compensation cost related to nonvested share-based compensation arrangements granted under our plans. This cost is expected to be recognized over a weighted-average period of 1.8 years as stock-based compensation expense. This expected cost does not include the impact of any future stock-based compensation awards. Refer to Note 15 of Notes to Consolidated Financial Statements.
Total selling, general and administrative expenses were approximately 8 percent higher in 2006 versus 2005. The increases in selling and advertising expenses were primarily related to increased investments in marketing activities, including World Cup and Winter Olympics promotions in the European Union, combined with new product innovation activities and increased costs in our consolidated bottling investments as a result of acquisitions and consolidation of certain bottling operations. General and administrative expenses increased due to higher costs in Bottling Investments related to the acquisitions of CCCIL and TJC and the consolidation of Brucephil under Interpretation No. 46(R). The acquisition of Bremer during the third quarter of 2005 also increased general and administrative expenses in 2006,
49
Table of Contents
reflecting a full-year impact in 2006 for Bremer compared to a partial year in 2005. General and administrative expenses in 2006 also reflected the impact of a $100 million donation made to The Coca-Cola Foundation, which impacted Corporate. Stock-based compensation expense was flat in 2006 compared to 2005. Stock-based compensation expense in 2005 included approximately $50 million of expense due to a change in our estimated service period for retirement-eligible participants in our plans. This amount was offset primarily by the impact of the timing of stock-based compensation grants in prior years.
Other Operating Charges
The other operating charges incurred by operating segment were as follows (in millions):
| Year Ended December 31, | 2007 | 2006 | 2005 | ||||||
| Africa |
$ | 34 | $ | 3 | $ | | |||
| Eurasia |
3 | | | ||||||
| European Union |
33 | 36 | | ||||||
| Latin America |
4 | | | ||||||
| North America |
23 | | | ||||||
| Pacific |
3 | 62 | 85 | ||||||
| Bottling Investments |
33 | 83 | | ||||||
| Corporate |
121 | 1 | | ||||||
| Total |
$ | 254 | $ | 185 | $ | 85 | |||
Other operating charges in 2007 were primarily related to restructuring costs and asset write-downs. These restructuring costs and asset write-downs included the reorganization of the North American business around three main business units: Sparkling Beverages, Still Beverages and Emerging Brands. They also included the plan to close a beverage concentrate manufacturing and distribution plant in Drogheda, Ireland, as well as individually insignificant streamlining activities throughout many other business units. The total cost of these restructuring activities is expected to be approximately $342 million. These costs are expected to be incurred through mid-2008. The expected payback period is three to four years. Refer to Note 18 of Notes to Consolidated Financial Statements. Also in 2007, other operating charges included charges related to the impairment of certain assets, none of which was individually significant.
During 2006, our Company recorded other operating charges of $185 million. Of these charges, approximately $108 million were primarily related to the impairment of assets and investments in our bottling operations, approximately $53 million were for contract termination costs related to production capacity efficiencies and approximately $24 million were related to other restructuring costs. None of these charges was individually significant. The impairment charges were primarily the result of a revised outlook for certain assets and bottling operations in Asia, which have been impacted by unfavorable market conditions and declines in volume. Refer to the discussion under Critical Accounting Policies and EstimatesGoodwill, Trademarks and Other Intangible Assets, above.
Other operating charges in 2005 reflected the impact of approximately $84 million of expenses related to impairment charges for intangible assets and approximately $1 million related to impairments of other assets. These intangible assets primarily relate to trademark beverages sold in the Philippines, which is part of the Pacific. Refer to the heading Critical Accounting Policies and EstimatesGoodwill, Trademarks and Other Intangible Assets.
50
Table of Contents
Operating Income and Operating Margin
Information about our operating income contribution by operating segment on a percentage basis is as follows:
| Year Ended December 31, | 2007 | 2006 | 2005 | ||||||
| Africa |
6.2 | % | 6.7 | % | 6.5 | % | |||
| Eurasia |
5.3 | 4.3 | 3.3 | ||||||
| European Union |
36.0 | 35.7 | 36.5 | ||||||
| Latin America |
24.1 | 22.8 | 19.3 | ||||||
| North America |
23.4 | 26.7 | 25.5 | ||||||
| Pacific |
23.4 | 26.2 | 29.9 | ||||||
| Bottling Investments |
2.1 | 0.3 | (0.6 | ) | |||||
| Corporate |
(20.5 | ) | (22.7 | ) | (20.4 | ) | |||
| 100.0 | % | 100.0 | % | 100.0 | % |
Information about our operating margin on a consolidated basis and by operating segment is as follows:
| Year Ended December 31, | 2007 | 2006 | 2005 | ||||||
| Consolidated |
25.1 | % | 26.2 | % | 26.3 | % | |||
| Africa |
35.3 | % | 38.4 | % | 35.8 | % | |||
| Eurasia |
39.2 | 34.8 | 30.5 | ||||||
| European Union |
63.0 | 61.6 | 52.1 | ||||||
| Latin America |
57.0 | 57.9 | 57.0 | ||||||
| North America |
21.9 | 24.0 | 23.3 | ||||||
| Pacific |
42.5 | 41.4 | 43.8 | ||||||
| Bottling Investments |
2.0 | 0.4 | 0.9 | ||||||
| Corporate |
* | * | * |
| * | Calculation is not meaningful. |
As demonstrated by the tables above, the percentage contribution to operating income and operating margin by each operating segment fluctuated from year to year. Operating income and operating margin by operating segment were influenced by a variety of factors and events including the following:
| | In 2007, foreign currency exchange rates favorably impacted operating income by approximately 4 percent, primarily related to a stronger euro, which impacted the European Union and Bottling Investments, a stronger Brazilian real, which impacted Latin America and Bottling Investments, and a stronger Australian dollar, which impacted the Pacific and Bottling Investments. The favorable impact of the fluctuation in these currencies was partially offset by a weaker Japanese yen, which impacted the Pacific, and a weaker South African rand, which impacted Africa and Bottling Investments. Refer to the heading Foreign Exchange. |
| | In 2007, price increases across the majority of operating segments favorably impacted both operating income and operating margins. |
| | In 2007, increased spending on marketing and innovation activities impacted the majority of the operating segments operating income. Refer to the heading Selling, General and Administrative Expenses. |
| | In 2007, operating income was reduced by approximately $34 million for Africa, $3 million for Eurasia, $33 million for the European Union, $4 million for Latin America, $23 million for North America, $3 million for the Pacific, $47 million for Bottling Investments and $121 million for Corporate, primarily due to restructuring costs and asset write-downs, included in other operating charges and cost of goods sold. Refer to Note 18 of Notes to Consolidated Financial Statements. |
51
Table of Contents
| | In 2007, operating income and operating margin for Latin America, North America and the Pacific reflected the impact of increases in the cost of raw materials primarily in the finished goods businesses. |
| | In 2007, operating income and operating margin for Bottling Investments reflected the impact of acquisitions and the consolidation of certain bottling operations. |
| | In 2006, foreign currency exchange rates unfavorably impacted operating income by approximately 1 percent, primarily related to a weaker Japanese yen, which impacted the Pacific. The unfavorable impact from the weaker Japanese yen was partially offset by favorable foreign currency exchange rate changes primarily related to the euro, which impacted the European Union and Bottling Investments, and the Brazilian real, which impacted Latin America and Bottling Investments. Refer to the heading Foreign Exchange. |
| | In 2006, price increases across the majority of operating segments favorably impacted both operating income and operating margins. |
| | In 2006, increased spending on marketing and innovation activities impacted the majority of the operating segments operating income and operating margins. Refer to the heading Selling, General and Administrative Expenses. |
| | In 2006, operating income was reduced by approximately $3 million for Africa, $36 million for the European Union, $62 million for the Pacific, $87 million for Bottling Investments and $1 million for Corporate primarily due to contract termination costs related to production capacity efficiencies, asset impairments and other restructuring costs. Refer to Note 19 and Note 21 of Notes to Consolidated Financial Statements. |
| | In 2006, the increase in operating margin for the European Union was primarily due to a change in the business model in Spain. Refer to the headings Net Operating Revenues and Gross Profit, above. |
| | In 2006, the decrease in operating income and operating margin for the Pacific was primarily due to an unfavorable product mix in Japan. |
| | In 2006, the increase in operating income and operating margin for Bottling Investments was primarily due to price increases, favorable package mix and actions to improve efficiency. |
| | In 2006, operating income was reduced by $100 million for Corporate as a result of a donation made to The Coca-Cola Foundation. |
| | In 2005, the Pacific operating segment reflected impairment charges totaling approximately $85 million related to the Philippines. Refer to the heading Other Operating Charges. |
| | In 2005, operating income in Corporate reflected our receipt of a net settlement of approximately $47 million related to a class action lawsuit concerning the purchase of HFCS. Refer to the heading Gross Profit. |
Interest Income and Interest Expense
Our Company monitors our mix of fixed-rate and variable-rate debt as well as our mix of short-term debt versus long-term debt. This monitoring includes a review of business and other financial risks. From time to time, we enter into interest rate swap agreements and other related instruments to manage our mix of fixed-rate and variable-rate debt.
In 2007, interest income increased by $43 million compared to 2006, primarily due to higher average short-term investment balances, partially offset by a decline in interest rates.
Interest expense in 2007 increased by $236 million compared to 2006, primarily due to issuance of $1,750 million of notes due November 15, 2017, and higher average balances on commercial paper borrowings in the United States, partially offset by a decline in interest rates. The proceeds from this $1,747 million long-term debt issuance and commercial paper borrowings were primarily used to finance current-year acquisitions. We expect 2008 net interest expense to increase due to forecasted higher average debt balances for the year, partially offset by an expected decline in U.S. interest rates. The increase in higher average forecasted debt balances is due to carrying indebtedness incurred in connection with 2007 acquisitions for a full year versus a partial year in 2007.
52
Table of Contents
In 2006, interest income decreased by $42 million compared to 2005, primarily due to lower average short-term investment balances, partially offset by higher average interest rates. Interest expense in 2006 decreased by $20 million compared to 2005. This decrease is primarily the result of lower average balances on commercial paper borrowings, partially offset by higher average interest rates.
Equity IncomeNet
Our Companys proportionate share of income from equity method investments for 2007 totaled $668 million, compared to $102 million in 2006, an increase of $566 million. The increase in equity incomenet reflected the impact of impairment charges recorded by CCE in 2006. Refer to the heading Critical Accounting Policies and EstimatesGoodwill, Trademarks and Other Intangible Assets. Equity incomenet also increased due to our proportionate share of increased net income from certain of our equity method investees as a result of the overall improving health of the Coca-Cola bottling system in most of the world, our proportionate share of tax benefits recorded by CCE and the favorable impact of foreign exchange fluctuations. The increase in equity incomenet was partially offset by our proportionate share of restructuring costs recorded by CCE in 2007, the write-off of assets related to excess bottles and cases at CCBPI in 2007, the sale of our ownership interest in Vonpar Refrescos S.A. (Vonpar), a bottler headquartered in Brazil, in January 2007, and the sale of a portion of our investment in Coca-Cola Amatil in September 2007. In February 2007, CCE announced that it would restructure segments of its Corporate, North America and European operations. As a part of the restructuring, CCE expects a net job reduction of approximately 3,500 positions, or 5 percent of its total workforce. CCE expects this restructuring will result in a charge of approximately $300 million, with the majority to be recognized in 2007 and 2008. The Companys equity income in 2008 will reflect our proportionate share of the restructuring charges recorded by CCE. In addition, impairment charges related to investments by Coca-Cola Amatil in bottling operations in South Korea unfavorably impacted our equity incomenet by approximately $62 million in 2007. The reduction in the Companys ownership position in Coca-Cola FEMSA in November 2006, as well as the sale of a portion of our investment in Coca-Cola Icecek A.S. (Coca-Cola Icecek) in an initial public offering during the second quarter of 2006, also impacted our equity incomenet. Our ownership interest in Coca-Cola FEMSA was reduced from approximately 40 percent to approximately 32 percent, and our Companys interest in Coca-Cola Icecek decreased from approximately 36 percent to approximately 20 percent. In 2007, the Company acquired a 50 percent interest in Jugos del Valle and a 34 percent interest in Tokyo Coca-Cola Bottling Company (Tokyo CCBC) which are accounted for under the equity method. The Company expects that these investments in Jugos del Valle and Tokyo CCBC will favorably impact our future equity incomenet.
Our Companys share of income from equity method investments for 2006 totaled $102 million, compared to $680 million in 2005, a decrease of $578 million. Equity income in 2006 was reduced by approximately $602 million resulting from the impact of our proportionate share of an impairment charge recorded by CCE. CCE recorded a $2.9 billion pretax ($1.8 billion after tax) impairment of its North American franchise rights. The decline in the estimated fair value of CCEs North American franchise rights was the result of several factors, including but not limited to (1) CCEs revised outlook on 2007 raw material costs driven by significant increases in aluminum and HFCS; (2) a challenging marketplace environment with increased pricing pressures in several high-growth beverage categories; and (3) increased interest rates contributing to a higher discount rate and corresponding capital charge. Our 2006 equity incomenet also reflected a net decrease of approximately $37 million primarily related to other impairment and restructuring charges recorded by CCE and certain other equity method investees, partially offset by approximately $33 million related to our proportionate share of favorable changes in certain of CCEs state and Canadian federal and provincial tax rates. In addition, our 2006 equity income was slightly impacted by the Companys sale of shares representing 8 percent of the capital stock of Coca-Cola FEMSA. The Company sold these shares to Fomento Economico Mexicano, S.A.B. de C.V. (FEMSA), the major shareowner of Coca-Cola FEMSA, in November 2006. As a result of this sale, our ownership interest in Coca-Cola FEMSA was reduced from approximately 40 percent to approximately 32 percent. The decrease in 2006 equity income was also the result of the sale of a portion of our investment in Coca-Cola Icecek in an initial public offering during the second quarter of 2006. As a result of this public offering, our Companys interest in Coca-Cola Icecek decreased from approximately 36 percent to approximately 20 percent. These reductions in ownership of Coca-Cola FEMSA and Coca-Cola Icecek reduced our
53
Table of Contents
equity income for the years ended December 31, 2007 and 2006. Refer to Note 3 of Notes to Consolidated Financial Statements. The decrease in equity income for 2006 was partially offset by our Companys proportionate share of increased net income from certain of the equity method investees and our proportionate share of the net income of the Multon juice joint venture in Russia.
Other Income (Loss)Net
Other income (loss)net was income of $173 million for 2007 compared to income of $195 million for 2006, a decrease of $22 million. In 2007, other income (loss)net included a gain of approximately $73 million resulting from the sale of a portion of the Companys ownership interest in Coca-Cola Amatil. Our ownership interest in Coca-Cola Amatil was reduced from approximately 32 percent to 30 percent. In 2007, other income (loss)net also included a gain of approximately $70 million resulting from the sale of our equity investment in Vonpar and gains of approximately $84 million resulting from the sale of real estate in Spain and the United States. Refer to Note 19 of Notes to Consolidated Financial Statements. Other income (loss)net also included the impact of foreign currency exchange gains and losses, accretion expenses related to certain acquisitions and the minority shareowners proportionate share of net income of certain consolidated subsidiaries. None of these items was individually significant in 2007.
Other income (loss)net was a net income of $195 million for 2006 compared to a net loss of $93 million for 2005, a difference of $288 million. In 2006, other income (loss)net included a gain of approximately $175 million resulting from the sale of a portion of our Coca-Cola FEMSA shares to FEMSA and a gain of approximately $123 million resulting from the sale of a portion of our investment in Coca-Cola Icecek shares in an initial public offering. Refer to Note 19 of Notes to Consolidated Financial Statements. This line item in 2006 also included $15 million in foreign currency exchange losses, the accretion of $58 million for the discounted value of our liability to purchase Coca-Cola Erfrischungsgetraenke AG (CCEAG) shares (refer to Note 8 of Notes to Consolidated Financial Statements) and the minority shareowners proportional share of net income of certain consolidated subsidiaries.
Gains on Issuances of Stock by Equity Method Investees
When one of our equity method investees issues additional shares to third parties, our percentage ownership interest in the investee decreases. In the event the issuance price per share is higher or lower than our average carrying amount per share, we recognize a noncash gain or loss on the issuance, when appropriate. This noncash gain or loss, net of any deferred taxes, is recognized in our net income in the period the change of ownership interest occurs.
In 2007 and 2006, our equity method investees did not issue any additional shares to third parties that resulted in our Company recording any noncash pretax gains or losses.
In 2005, our Company recorded approximately $23 million of noncash pretax gains on the issuances of stock by equity method investees. The issuances primarily related to Coca-Cola Amatils issuance of common stock in connection with the acquisition of SPC Ardmona Pty. Ltd., an Australian packaged fruit company. These issuances of common stock reduced our ownership interest in the total outstanding shares of Coca-Cola Amatil from approximately 34 percent to approximately 32 percent.
Income Taxes
Our effective tax rate reflects tax benefits derived from significant operations outside the United States, which are generally taxed at rates lower than the U.S. statutory rate of 35 percent. A change in the mix of pretax income from these various tax jurisdictions can have a significant impact on the Companys periodic effective tax rate.
Our effective tax rate of approximately 24.0 percent for the year ended December 31, 2007, included the following:
| | a tax charge of approximately $96 million related to amounts required to be recorded for changes to our uncertain tax positions under Interpretation No. 48, including interest and penalties; |
| | a tax benefit of approximately $19 million related to tax rate changes in Germany; |
54
Table of Contents
| | a tax charge related to the gains on the sale of a portion of our equity interest in Coca-Cola Amatil and Vonpar, at a combined effective tax rate of 58 percent, or approximately $83 million; |
| | a tax benefit related to restructuring charges and asset write-downs recorded by the Company, at an effective tax rate of 18 percent, or approximately $49 million; and |
| | the impact of an approximate 14 percent combined effective tax rate on our proportionate share of restructuring charges and tax rate changes recorded by CCE and the impairment of assets recorded by CCBPI and Coca-Cola Amatil. Refer to Note 19 of Notes to Consolidated Financial Statements. |
Our effective tax rate of approximately 22.8 percent for the year ended December 31, 2006, included the following:
| | a tax benefit of approximately 1.8 percent primarily related to the sale of a portion of our investments in Coca-Cola Icecek and Coca-Cola FEMSA. The tax benefit was a result of the reversal of a valuation allowance that covered certain deferred tax assets recorded on capital loss carryforwards. The reversal of the valuation allowance was offset by a reduction of deferred tax assets due to the utilization of these capital loss carryforwards. These capital loss carryforwards offset the taxable gain on the sale of a portion of our investments in Coca-Cola Icecek and Coca-Cola FEMSA. Also included in this tax benefit is the reversal of the deferred tax liability recorded for the differences between the financial reporting and tax bases in the stock sold; |
| | an income tax benefit primarily related to the impairment of assets and investments in our bottling operations, contract termination costs related to production capacity efficiencies and other restructuring charges at a rate of approximately 16 percent; |
| | a tax charge of approximately $24 million related to the resolution of certain tax matters; and |
| | an income tax benefit related to our proportionate share of CCEs charges recorded at a rate of approximately 8.8 percent. Refer to Note 3 and Note 19 of Notes to Consolidated Financial Statements. |
Our effective tax rate of approximately 27.2 percent for the year ended December 31, 2005, included the following:
| | an income tax benefit primarily related to the Philippines impairment charges at a rate of approximately 4 percent; |
| | an income tax benefit of approximately $101 million related to the reversal of previously accrued taxes resulting from the favorable resolution of various tax matters; and |
| | a tax provision of approximately $315 million related to repatriation of previously unremitted foreign earnings under the Jobs Creation Act. |
The Company adopted the provisions of Interpretation No. 48 effective January 1, 2007. As a result of the implementation of Interpretation No. 48, the Company recorded an increase of approximately $65 million in liabilities for unrecognized tax benefits, which was accounted for as a reduction to the January 1, 2007 balance of reinvested earnings. As of December 31, 2007, the gross amount of unrecognized tax benefits was approximately $643 million. If the Company were to prevail on all uncertain tax positions, the net effect would be a benefit to the Companys effective tax rate of approximately $147 million. The remaining approximately $496 million, which was recorded as a deferred tax asset, primarily represents tax benefits that would be received in different tax jurisdictions in the event that the Company did not prevail on all uncertain tax positions. The Company recognizes accrued interest and penalties related to unrecognized tax benefits in income tax expense. The Company had approximately $272 million in interest and penalties related to unrecognized tax benefits accrued as of December 31, 2007. If the Company were to prevail on all uncertain tax positions, the reversal of this accrual would also be a benefit to the Companys effective tax rate.
Based on current tax laws, the Companys effective tax rate in 2008 is expected to be approximately 22.0 to 22.5 percent before considering the effect of any unusual or special items that may affect our tax rate in future years.
55
Table of Contents
Liquidity, Capital Resources and Financial Position
We believe our ability to generate cash from operating activities is one of our fundamental financial strengths. Our Company expects to meet all of our financial commitments and operating needs for the foreseeable future. We expect to use cash generated from operating activities primarily for dividends, share repurchases, acquisitions and aggregate contractual obligations.
Cash Flows from Operating Activities
Net cash provided by operating activities for the years ended December 31, 2007, 2006 and 2005 was approximately $7.1 billion, $6.0 billion and $6.4 billion, respectively.
Cash flows from operating activities increased 20 percent in 2007 compared to 2006. This increase was primarily related to increased cash receipts from customers in 2007, which was driven by a 20 percent rise in net operating revenues. These higher cash collections were offset in part by increased payments to suppliers and vendors in 2007, primarily related to the increased cost of goods sold to support the higher sales volumes, and secondarily related to higher cash payments for selling, general and administrative related costs. Cash flows from operating activities in 2007 were also reduced due to an increase in interest payments of $193 million and an increase in cash payments for streamlining initiatives of $83 million. Cash flows from operating activities in 2006 reflected the contribution and donation discussed below.
Cash flows from operating activities decreased 7 percent in 2006 compared to 2005. This decrease was primarily the result of payments in 2006 of marketing accruals recorded in 2005 related to increased marketing and innovation activities and increased tax payments made in the first quarter of 2006 related to the 2005 repatriation of foreign earnings under the Jobs Creation Act. This decrease was partially offset by an increase in cash receipts in 2006 from customers, which was driven by a 4 percent growth in net operating revenues. Our cash flows from operating activities in 2006 also decreased versus 2005 as a result of a contribution of approximately $216 million to a U.S. Voluntary Employee Beneficiary Association (VEBA), a tax-qualified trust to fund retiree medical benefits (refer to Note 16 of Notes to Consolidated Financial Statements) and a $100 million donation made to The Coca-Cola Foundation.
Cash Flows from Investing Activities
Our cash flows used in investing activities are summarized as follows (in millions):
| Year Ended December 31, | 2007 | 2006 | 2005 | |||||||||
| Cash flows (used in) provided by investing activities: |
||||||||||||
| Acquisitions and investments, principally beverage and bottling companies |
$ | (5,653 | ) | $ | (901 | ) | $ | (637 | ) | |||
| Purchases of other investments |
(99 | ) | (82 | ) | (53 | ) | ||||||
| Proceeds from disposals of other investments |
448 | 640 | 33 | |||||||||
| Purchases of property, plant and equipment |
(1,648 | ) | (1,407 | ) | (899 | ) | ||||||
| Proceeds from disposals of property, plant and equipment |
239 | 112 | 88 | |||||||||
| Other investing activities |
(6 | ) | (62 | ) | (28 | ) | ||||||
| Net cash used in investing activities |
$ | (6,719 | ) | $ | (1,700 | ) | $ | (1,496 | ) | |||
Net purchases of property, plant and equipment for the years ended December 31, 2007, 2006 and 2005 were approximately $1,409 million, $1,295 million and $811 million, respectively. The increase is primarily related to acquisitions of certain bottling operations in 2007 and 2006. Generally, bottling and finished product operations are more capital intensive compared to concentrate and syrup operations. Our Company currently estimates that net purchases of property, plant and equipment in 2008 will be approximately $1.6 billion to $1.7 billion.
56
Table of Contents
Total capital expenditures for property, plant and equipment (including our investments in information technology) and the percentage of such totals by operating segment for 2007, 2006 and 2005 were as follows:
| Year Ended December 31, | 2007 | 2006 | 2005 | |||||||||
| Capital expenditures (in millions) |
$ | 1,648 | $ | 1,407 | $ | 899 | ||||||
| Africa |
2.4 | % | 2.7 | % | 2.5 | % | ||||||
| Eurasia |
2.3 | 0.4 | 0.6 | |||||||||
| European Union |
4.6 | 6.6 | 8.6 | |||||||||
| Latin America |
2.8 | 3.1 | 2.7 | |||||||||
| North America |
20.9 | 29.9 | 29.5 | |||||||||
| Pacific |
11.6 | 9.5 | 10.1 | |||||||||
| Bottling Investments |
39.1 | 29.7 | 29.4 | |||||||||
| Corporate |
16.3 | 18.1 | 16.6 | |||||||||
Acquisitions and investments accounted for approximately $5,653 million in 2007, $901 million in 2006 and $637 million in 2005.
In 2007, our Company acquired glacéau, 18 German bottling and distribution operations, Fuze and Leao Junior. Our Company also completed the acquisition of the remaining 65 percent of the shares of capital stock of CCBPI not previously owned by our Company. In addition, the Company acquired a 50 percent interest in Jugos del Valle, a 34 percent interest in Tokyo CCBC and an 11 percent interest in Nordeste Refrigerantes S.A. (NORSA). Refer to Note 20 of Notes to Consolidated Financial Statements. The remaining amount of cash used for acquisitions and investments was primarily related to the acquisition of various trademarks and brands, none of which was individually significant.
In 2006, our Company acquired a controlling interest in CCCIL and acquired Apollinaris and TJC. Refer to Note 20 of Notes to Consolidated Financial Statements. The remaining amount of cash used for acquisitions and investments was primarily related to the acquisition of various trademarks and brands, none of which was individually significant.
In April 2005, our Company and Coca-Cola Hellenic jointly acquired Multon for a total purchase price of approximately $501 million, split equally between the Company and Coca-Cola Hellenic. During the third quarter of 2005, our Company acquired the German bottling company Bremer for approximately $160 million from InBev SA. Also in 2005, the Company acquired Sucos Mais, a Brazilian juice company, and completed the acquisition of the remaining 49 percent interest in the business of CCDA Waters L.L.C. not previously owned by our Company. Refer to Note 20 of Notes to Consolidated Financial Statements.
Investing activities in 2007 also included proceeds of approximately $238 million received from the sale of our 49 percent equity interest in Vonpar, approximately $143 million received from the sale of a portion of our interest in Coca-Cola Amatil, and approximately $106 million in proceeds from the sales of real estate in Spain and in the United States.
Investing activities in 2006 also included proceeds of approximately $198 million received from the sale of shares in connection with the initial public offering of Coca-Cola Icecek and proceeds of approximately $427 million received from the sale of a portion of Coca-Cola FEMSA shares to FEMSA. Refer to Note 3 of Notes to Consolidated Financial Statements.
57
Table of Contents
Cash Flows from Financing Activities
Our cash flows used in financing activities were as follows (in millions):
| Year Ended December 31, | 2007 | 2006 | 2005 | |||||||||
| Cash flows provided by (used in) financing activities: |
||||||||||||
| Issuances of debt |
$ | 9,979 | $ | 617 | $ | 178 | ||||||
| Payments of debt |
(5,638 | ) | (2,021 | ) | (2,460 | ) | ||||||
| Issuances of stock |
1,619 | 148 | 230 | |||||||||
| Purchases of stock for treasury |
(1,838 | ) | (2,416 | ) | (2,055 | ) | ||||||
| Dividends |
(3,149 | ) | (2,911 | ) | (2,678 | ) | ||||||
| Net cash provided by (used in) financing activities |
$ | 973 | $ | (6,583 | ) | $ | (6,785 | ) | ||||
Debt Financing
Our Company maintains debt levels we consider prudent based on our cash flows, interest coverage ratio and percentage of debt to capital. We use debt financing to lower our overall cost of capital, which increases our return on shareowners equity. This exposes us to adverse changes in interest rates. Our interest expense may also be affected by our credit ratings.
As of December 31, 2007, our long-term debt was rated A+ by Standard & Poors and Aa3 by Moodys, and our commercial paper program was rated A-1 and P-1 by Standard & Poors and Moodys, respectively. In assessing our credit strength, both Standard & Poors and Moodys consider our capital structure and financial policies as well as the aggregated balance sheet and other financial information for the Company and certain bottlers, including CCE and Coca-Cola Hellenic. While the Company has no legal obligation for the debt of these bottlers, the rating agencies believe the strategic importance of the bottlers to the Companys business model provides the Company with an incentive to keep these bottlers viable. It is our expectation that the credit rating agencies will continue using this methodology. If our credit ratings were to be downgraded as a result of changes in our capital structure, our major bottlers financial performance, changes in the credit rating agencies methodology in assessing our credit strength or for any other reason, our cost of borrowing could increase. Additionally, if certain bottlers credit ratings were to decline, the Companys share of equity income could be reduced as a result of the potential increase in interest expense for these bottlers.
We monitor our interest coverage ratio and, as indicated above, the rating agencies consider our ratio in assessing our credit ratings. However, the rating agencies aggregate financial data for certain bottlers along with our Company when assessing our debt rating. As such, the key measure to rating agencies is the aggregate interest coverage ratio of the Company and certain bottlers. Both Standard & Poors and Moodys employ different aggregation methodologies and have different thresholds for the aggregate interest coverage ratio. These thresholds are not necessarily permanent, nor are they fully disclosed to our Company.
Our global presence and strong capital position give us access to key financial markets around the world, enabling us to raise funds at a low effective cost. This posture, coupled with active management of our mix of short-term and long-term debt and our mix of fixed-rate and variable-rate debt, results in a lower overall cost of borrowing. Our debt management policies, in conjunction with our share repurchase programs and investment activity, can result in current liabilities exceeding current assets.
Issuances and payments of debt included both short-term and long-term financing activities. On December 31, 2007, we had approximately $4,963 million in lines of credit and other short-term credit facilities available, of which approximately $499 million was outstanding. The outstanding amount of $499 million was primarily related to our international operations.
The issuances of debt in 2007 primarily included approximately $6,024 million of issuances of commercial paper and short-term debt with maturities of greater than 90 days, approximately $1,750 million in issuances of long-term notes due November 15, 2017, and approximately $2,024 million of net issuances of commercial paper and short-term
58
Table of Contents
debt with maturities of 90 days or less. The increases in debt were primarily due to our acquisitions of 18 German bottling and distribution operations, glacéau, CCBPI, Fuze, Leao Junior, Jugos del Valle and our investment in Tokyo CCBC in 2007. During the fourth quarter of 2007, the Company decided to replace a certain amount of commercial paper and short-term debt with longer-term debt. Refer to Note 9 of Notes to Consolidated Financial Statements. The Company continues to review its optimal mix of short-term and long-term debt. We may replace a certain amount of commercial paper and short-term debt with longer term debt in the future. The payments of debt in 2007 primarily included approximately $5,514 million related to commercial paper and short-term debt with maturities of greater than 90 days. Included in these payments was the payment of the outstanding liability to CCEAG shareowners in January 2007 of $1,068 million.
The issuances of debt in 2006 primarily included approximately $484 million of issuances of commercial paper and short-term debt with maturities of greater than 90 days. The payments of debt in 2006 primarily included approximately $580 million related to commercial paper and short-term debt with maturities of greater than 90 days and approximately $1,383 million of net repayments of commercial paper and short-term debt with maturities of 90 days or less.
The issuances of debt in 2005 primarily included approximately $144 million of issuances of commercial paper with maturities of 90 days or more. The payments of debt primarily included approximately $1,037 million related to net repayments of commercial paper with maturities of less than 90 days, repayments of commercial paper with maturities greater than 90 days of approximately $32 million and repayment of approximately $1,363 million of long-term debt.
Issuances of Stock
The issuances of stock in 2007 primarily related to the exercise of stock options by Company employees. In addition, certain executive officers and former shareholders of glacéau invested approximately $179 million of their proceeds from the sale of glacéau in common stock of the Company at then current market prices. These shares of Company common stock were placed in escrow pursuant to the glacéau acquisition agreement.
Share Repurchases
In October 1996, our Board of Directors authorized a plan (1996 Plan) to repurchase up to 206 million shares of our Companys common stock through 2006. On July 20, 2006, the Board of Directors of the Company authorized a new share repurchase program of up to 300 million shares of the Companys common stock. The new program took effect upon the expiration of the 1996 Plan on October 31, 2006. The table below presents annual shares repurchased and average price per share:
| Year Ended December 31, | 2007 | 2006 | 2005 | ||||||
| Number of shares repurchased (in millions) |
34 | 55 | 46 | ||||||
| Average price per share |
$ | 51.66 | $ | 45.19 | $ | 43.26 | |||
Since the inception of our initial share repurchase program in 1984 through our current program as of December 31, 2007, we have purchased approximately 1.3 billion shares of our Companys common stock at an average price per share of $18.45.
As strong cash flows are expected to continue in the future, the Company currently expects 2008 share repurchases to be in the range of $1.5 billion to $2.0 billion.
Dividends
At its February 2008 meeting, our Board of Directors increased our quarterly dividend by 12 percent, raising it to $0.38 per share, equivalent to a full-year dividend of $1.52 per share in 2008. This is our 46th consecutive annual increase. Our annual common stock dividend was $1.36 per share, $1.24 per share and $1.12 per share in 2007, 2006
59
Table of Contents
and 2005, respectively. The 2007 dividend represented a 10 percent increase from 2006, and the 2006 dividend represented a 10 percent increase from 2005.
Off-Balance Sheet Arrangements and Aggregate Contractual Obligations
Off-Balance Sheet Arrangements
In accordance with the definition under SEC rules, the following qualify as off-balance sheet arrangements:
| | any obligation under certain guarantee contracts; |
| | a retained or contingent interest in assets transferred to an unconsolidated entity or similar arrangement that serves as credit, liquidity or market risk support to that entity for such assets; |
| | any obligation under certain derivative instruments; and |
| | any obligation arising out of a material variable interest held by the registrant in an unconsolidated entity that provides financing, liquidity, market risk or credit risk support to the registrant, or engages in leasing, hedging or research and development services with the registrant. |
As of December 31, 2007, we were contingently liable for guarantees of indebtedness owed by third parties in the amount of approximately $267 million. These guarantees primarily are related to third-party customers, bottlers and vendors and have arisen through the normal course of business. These guarantees have various terms, and none of these guarantees was individually significant. The amount represents the maximum potential future payments that we could be required to make under the guarantees; however, we do not consider it probable that we will be required to satisfy these guarantees. Management concluded that the likelihood of any material amounts being paid by our Company under these guarantees is not probable. As of December 31, 2007, we were not directly liable for the debt of any unconsolidated entity, and we did not have any retained or contingent interest in assets as defined above.
Our Company recognizes all derivatives as either assets or liabilities at fair value in our consolidated balance sheets. Refer to Note 12 of Notes to Consolidated Financial Statements.
Aggregate Contractual Obligations
As of December 31, 2007, the Companys contractual obligations, including payments due by period, were as follows (in millions):
| Payments Due by Period | |||||||||||||||
| Total | 2008 | 2009-2010 | 2011-2012 | 2013 and Thereafter |
|||||||||||
| Short-term loans and notes payable1: |
|||||||||||||||
| Commercial paper borrowings |
$ | 5,420 | $ | 5,420 | $ | | $ | | $ | | |||||
| Lines of credit and other short-term borrowings |
499 | 499 | | | | ||||||||||
| Current maturities of long-term debt2 |
133 | 133 | | | | ||||||||||
| Long-term debt, net of current maturities2 |
3,277 | | 649 | 749 | 1,879 | ||||||||||
| Estimated interest payments3 |
1,955 | 197 | 339 | 265 | 1,154 | ||||||||||
| Accrued income taxes4 |
258 | 258 | | | | ||||||||||
| Purchase obligations5 |
13,445 | 6,891 | 2,247 | 815 | 3,492 | ||||||||||
| Marketing obligations6 |
4,219 | 1,708 | 868 | 591 | 1,052 | ||||||||||
| Lease obligations |
601 | 171 | 203 | 112 | 115 | ||||||||||
| Total contractual obligations4 |
$ | 29,807 | $ | 15,277 | $ | 4,306 | $ | 2,532 | $ | 7,692 | |||||
| 1 |
Refer to Note 8 of Notes to Consolidated Financial Statements for information regarding short-term loans and notes payable. Upon payment of outstanding commercial paper, we typically issue new commercial paper. Lines of credit and other short-term borrowings are expected to fluctuate depending upon current liquidity needs, especially at international subsidiaries. |
60
Table of Contents
| 2 |
Refer to Note 9 of Notes to Consolidated Financial Statements for information regarding long-term debt. We will consider several alternatives to settle this long-term debt, including the use of cash flows from operating activities, issuance of commercial paper or issuance of other long-term debt. |
| 3 |
We calculated estimated interest payments for long-term debt as follows: for fixed-rate debt, we calculated interest based on the applicable rates and payment dates; for variable-rate debt, we estimated interest rates and payment dates based on our determination of the most likely scenarios for each relevant debt instrument. We typically expect to settle such interest payments with cash flows from operating activities and/or short-term borrowings. |
| 4 |
Refer to Note 17 of Notes to Consolidated Financial Statements for information regarding income taxes. As of December 31, 2007, the noncurrent portion of our income tax liability, including accrued interest and penalties related to unrecognized tax benefits, was approximately $883 million, which was not included in the total above. At this time, the settlement period for the noncurrent portion of our income tax liability cannot be determined. In addition, any payments related to unrecognized tax benefits would be partially offset by reductions in payments in other jurisdictions. |
| 5 |
The purchase obligations include agreements to purchase goods or services that are enforceable and legally binding and that specify all significant terms, including long-term contractual obligations, open purchase orders, accounts payable and certain accrued liabilities. We expect to fund these obligations with cash flows from operating activities. |
| 6 |
We expect to fund these marketing obligations with cash flows from operating activities. |
In accordance with SFAS No. 87, Employers Accounting for Pensions, and SFAS No. 106, Employers Accounting for Postretirement Benefits Other Than Pensions, as amended by SFAS No. 158, Employers Accounting for Defined Benefit Pension and Other Postretirement Plansan amendment of FASB Statements No. 87, 88, 106, and 132(R), the total accrued benefit liability for pension and other postretirement benefit plans recognized as of December 31, 2007 was $873 million. Refer to Note 16 of Notes to Consolidated Financial Statements. This amount is impacted by, among other items, pension expense, funding levels, plan amendments, changes in plan demographics and assumptions, investment return on plan assets, and the application of SFAS No. 158. Because the accrued liability does not represent expected liquidity needs, we did not include this amount in the contractual obligations table.
The Pension Protection Act of 2006 (PPA) was enacted in August 2006 and established, among other things, new standards for funding of U.S. defined benefit pension plans. One of the primary objectives of the PPA is to improve the financial integrity of underfunded plans through the requirement of additional contributions. The requirements of the PPA will not have a significant impact on our financial condition because, under the provisions of the PPA, required contributions for the primary funded U.S. plan are projected to be zero through 2017 as a result of contributions we have made to the plan since 2001. Therefore, we did not include any amounts as a contractual obligation in the above table. We may, however, decide to make additional discretionary contributions to our pension and other benefit plans in future years. In addition, as a result of contributions totaling approximately $224 million in 2006 to fund a portion of our U.S. postretirement healthcare obligation, including a contribution of $216 million to a VEBA trust, we do not expect to contribute to our U.S. postretirement healthcare plan in 2008. We generally expect to fund all future contributions with cash flows from operating activities.
Our international pension plans are funded in accordance with local laws and income tax regulations. We do not expect contributions to these plans to be material in 2008 or thereafter. Therefore, no amounts have been included in the table above.
As of December 31, 2007, the projected benefit obligation of the U.S. qualified pension plans was $1,725 million, and the fair value of plan assets was approximately $2,255 million. As of December 31, 2007, the projected benefit obligation of all pension plans other than the U.S. qualified pension plans was approximately $1,792 million, and the fair value of all other pension plan assets was approximately $1,173 million. The majority of this underfunding is attributable to an international pension plan for certain non-U.S. employees that is unfunded due to tax law restrictions, as well as our unfunded U.S. nonqualified pension plans. These U.S. nonqualified pension plans provide, for certain associates, benefits that are not permitted to be funded through a qualified plan because of limits imposed by the
61
Table of Contents
Internal Revenue Code of 1986. Disclosure of amounts is not included in the above table regarding expected benefit payments for these unfunded pension plans. However, we anticipate annual benefit payments to be approximately $40 million in 2008, reduce to approximately $30 million in 2009 and remain near that level through 2032, decreasing annually thereafter. Refer to Note 16 of Notes to Consolidated Financial Statements.
Deferred income tax liabilities as of December 31, 2007 were approximately $1,919 million. Refer to Note 17 of Notes to Consolidated Financial Statements. This amount is not included in the total contractual obligations table because we believe this presentation would not be meaningful. Deferred income tax liabilities are calculated based on temporary differences between the tax bases of assets and liabilities and their respective book bases, which will result in taxable amounts in future years when the liabilities are settled at their reported financial statement amounts. The results of these calculations do not have a direct connection with the amount of cash taxes to be paid in any future periods. As a result, scheduling deferred income tax liabilities as payments due by period could be misleading, because this scheduling would not relate to liquidity needs.
Minority interests of approximately $358 million as of December 31, 2007, for consolidated entities in which we do not have a 100 percent ownership interest were recorded in the consolidated balance sheet line item other liabilities. Such minority interests are not liabilities requiring the use of cash or other resources; therefore, this amount is excluded from the contractual obligations table.
Foreign Exchange
Our international operations are subject to certain opportunities and risks, including currency fluctuations and governmental actions. We closely monitor our operations in each country and seek to adopt appropriate strategies that are responsive to changing economic and political environments, and to fluctuations in foreign currencies.
We use 68 functional currencies. Due to our global operations, weaknesses in some of these currencies might be offset by strength in others. In 2007, 2006 and 2005, the weighted-average exchange rates for foreign currencies in which the Company conducted operations (all operating currencies), and for certain individual currencies, strengthened (weakened) against the U.S. dollar as follows:
| Year Ended December 31, | 2007 | 2006 | 2005 | ||||||
| All operating currencies |
4 | % | (1 | )% | 2 | % | |||
| Brazilian real |
11 | % | 10 | % | 21 | % | |||
| Mexican peso |
0 | % | 0 | % | 4 | % | |||
| Australian dollar |
10 | % | (1 | )% | 3 | % | |||
| South African rand |
(3 | )% | (7 | )% | 1 | % | |||
| British pound |
9 | % | 1 | % | 0 | % | |||
| Euro |
8 | % | 1 | % | 1 | % | |||
| Japanese yen |
(2 | )% | (6 | )% | (1 | )% |
These percentages do not include the effects of our hedging activities and, therefore, do not reflect the actual impact of fluctuations in exchange rates on our operating results. Our foreign currency management program is designed to mitigate, over time, a portion of the impact of exchange rate changes on our net income and earnings per share. The total currency impact on operating income, including the effect of our hedging activities, was an increase of approximately 4 percent in 2007. The impact of a stronger U.S. dollar reduced our operating income by approximately 1 percent in 2006. The impact of a weaker U.S. dollar increased our operating income by approximately 4 percent in 2005. Based on the anticipated benefits of hedging coverage in place, the Company currently expects currencies to have a minimal impact on operating income in 2008.
Exchange lossesnet amounted to approximately $10 million in 2007, $15 million in 2006 and $23 million in 2005 and were recorded in other income (loss)net in our consolidated statements of income. Exchange lossesnet
62
Table of Contents
include the remeasurement of monetary assets and liabilities from certain currencies into functional currencies and the costs of hedging certain exposures of our consolidated balance sheets. Refer to Note 12 of Notes to Consolidated Financial Statements.
The Company will continue to manage its foreign currency exposure to mitigate, over time, a portion of the impact of exchange rate changes on net income and earnings per share.
Overview of Financial Position
Our consolidated balance sheet as of December 31, 2007, compared to our consolidated balance sheet as of December 31, 2006, was impacted by the effects of translation adjustments and the following:
| | increases in trade accounts receivable, inventories, and prepaid expenses and other assets of $730 million, $579 million and $637 million, respectively, primarily due to 2007 acquisitions, including glacéau, 18 German bottling and distribution operations, CCBPI, Fuze and Leao Junior (refer to Note 20 of Notes to Consolidated Financial Statements); |
| | increases in trademarks with indefinite lives, goodwill and other intangible assets of $3,108 million, $2,853 million and $1,123 million, respectively, primarily due to 2007 acquisitions, including glacéau, 18 German bottling and distribution operations, CCBPI, Fuze and Leao Junior (refer to Note 20 of Notes to Consolidated Financial Statements); |
| | an increase in the cost of property, plant and equipment of $2,533 million, primarily due to 2007 capital expenditures and acquisitions, including 18 German bottling and distribution operations and CCBPI (refer to Note 20 of Notes to Consolidated Financial Statements); |
| | an increase in accounts payable and accrued expenses of $1,860 million, primarily due to 2007 acquisitions, including glacéau, 18 German bottling and distribution operations, CCBPI, Fuze and Leao Junior (refer to Note 20 of Notes to Consolidated Financial Statements); |
| | an increase in loans and notes payable of $2,684 million, primarily due to net borrowings of commercial paper and short-term debt during 2007 to fund current-year acquisitions (refer to Note 20 of Notes to Consolidated Financial Statements); |
| | an increase in long-term debt of $1,963 million, primarily due to issuance of $1,750 million of notes due November 15, 2017, to repay short-term debt used to fund current-year acquisitions (refer to Note 20 of Notes to Consolidated Financial Statements); |
| | an increase in other liabilities of $902 million, primarily due to tax liabilities related to Interpretation No. 48 (refer to Note 17 of Notes to Consolidated Financial Statements) and additional liabilities related to 2007 acquisitions (refer to Note 20 of Notes to Consolidated Financial Statements); and |
| | an increase in deferred tax liabilities of $1,282 million, primarily due to 2007 acquisitions, including glacéau, 18 German bottling and distribution operations, CCBPI, Fuze and Leao Junior. Refer to Note 20 of Notes to Consolidated Financial Statements. |
Impact of Inflation and Changing Prices
Inflation affects the way we operate in many markets around the world. In general, we believe that, over time, we are able to increase prices to counteract the majority of the inflationary effects of increasing costs and to generate sufficient cash flows to maintain our productive capability.
63
Table of Contents
ITEM 7A. QUANTITATIVE AND QUALITATIVE DISCLOSURES ABOUT MARKET RISK
Our Company uses derivative financial instruments primarily to reduce our exposure to adverse fluctuations in interest rates and foreign currency exchange rates, commodity prices and other market risks. We do not enter into derivative financial instruments for trading purposes. As a matter of policy, all our derivative positions are used to reduce risk by hedging an underlying economic exposure. Because of the high correlation between the hedging instrument and the underlying exposure, fluctuations in the value of the instruments are generally offset by reciprocal changes in the value of the underlying exposure. The Company generally hedges anticipated exposures up to 36 months in advance; however, the majority of our derivative instruments expire within 24 months or less. Virtually all of our derivatives are straightforward, over-the-counter instruments with liquid markets.
Foreign Exchange
We manage most of our foreign currency exposures on a consolidated basis, which allows us to net certain exposures and take advantage of any natural offsets. In 2007, we generated approximately 74 percent of our net operating revenues from operations outside of the United States; therefore, weakness in one particular currency might be offset by strengths in other currencies over time. We use derivative financial instruments to further reduce our net exposure to currency fluctuations.
Our Company enters into forward exchange contracts and purchases currency options (principally euro and Japanese yen) and collars to hedge certain portions of forecasted cash flows denominated in foreign currencies. Additionally, we enter into forward exchange contracts to offset the earnings impact relating to exchange rate fluctuations on certain monetary assets and liabilities. We also enter into forward exchange contracts as hedges of net investments in international operations.
Interest Rates
We monitor our mix of fixed-rate and variable-rate debt, as well as our mix of short-term debt versus long-term debt. From time to time, we enter into interest rate swap agreements to manage our mix of fixed-rate and variable-rate debt.
Value-at-Risk
We monitor our exposure to financial market risks using several objective measurement systems, including value-at-risk models. Our value-at-risk calculations use a historical simulation model to estimate potential future losses in the fair value of our derivatives and other financial instruments that could occur as a result of adverse movements in foreign currency and interest rates. We have not considered the potential impact of favorable movements in foreign currency and interest rates on our calculations. We examined historical weekly returns over the previous 10 years to calculate our value-at-risk. The average value-at-risk represents the simple average of quarterly amounts over the past year. As a result of our foreign currency value-at-risk calculations, we estimate with 95 percent confidence that the fair values of our foreign currency derivatives and other financial instruments, over a one-week period, would decline by not more than approximately $20 million, $14 million and $9 million, respectively, using 2007, 2006 or 2005 average fair values, and by not more than approximately $19 million and $14 million, respectively, using December 31, 2007 and 2006 fair values. According to our interest rate value-at-risk calculations, we estimate with 95 percent confidence that any increase in our net interest expense due to an adverse move in our 2007 average or in our December 31, 2007, interest rates over a one-week period would not have a material impact on our consolidated financial statements. Our December 31, 2006 and 2005 estimates also were not material to our consolidated financial statements.
64
Table of Contents
ITEM 8. FINANCIAL STATEMENTS AND SUPPLEMENTARY DATA
65
Table of Contents
THE COCA-COLA COMPANY AND SUBSIDIARIES
CONSOLIDATED STATEMENTS OF INCOME
| Year Ended December 31, | 2007 | 2006 | 2005 | |||||||
| (In millions except per share data) | ||||||||||
| NET OPERATING REVENUES |
$ | 28,857 | $ | 24,088 | $ | 23,104 | ||||
| Cost of goods sold |
10,406 | 8,164 | 8,195 | |||||||
| GROSS PROFIT |
18,451 | 15,924 | 14,909 | |||||||
| Selling, general and administrative expenses |
10,945 | 9,431 | 8,739 | |||||||
| Other operating charges |
254 | 185 | 85 | |||||||
| OPERATING INCOME |
7,252 | 6,308 | 6,085 | |||||||
| Interest income |
236 | 193 | 235 | |||||||
| Interest expense |
456 | 220 | 240 | |||||||
| Equity incomenet |
668 | 102 | 680 | |||||||
| Other income (loss)net |
173 | 195 | (93 | ) | ||||||
| Gains on issuances of stock by equity method investees |
| | 23 | |||||||
| INCOME BEFORE INCOME TAXES |
7,873 | 6,578 | 6,690 | |||||||
| Income taxes |
1,892 | 1,498 | 1,818 | |||||||
| NET INCOME |
$ | 5,981 | $ | 5,080 | $ | 4,872 | ||||
| BASIC NET INCOME PER SHARE |
$ | 2.59 | $ | 2.16 | $ | 2.04 | ||||
| DILUTED NET INCOME PER SHARE |
$ | 2.57 | $ | 2.16 | $ | 2.04 | ||||
| AVERAGE SHARES OUTSTANDING |
2,313 | 2,348 | 2,392 | |||||||
| Effect of dilutive securities |
18 | 2 | 1 | |||||||
| AVERAGE SHARES OUTSTANDING ASSUMING DILUTION |
2,331 | 2,350 | 2,393 | |||||||
Refer to Notes to Consolidated Financial Statements.
66
Table of Contents
THE COCA-COLA COMPANY AND SUBSIDIARIES
CONSOLIDATED BALANCE SHEETS
| December 31, | 2007 | 2006 | ||||||
| (In millions except par value) | ||||||||
| ASSETS |
||||||||
| CURRENT ASSETS |
||||||||
| Cash and cash equivalents |
$ | 4,093 | $ | 2,440 | ||||
| Marketable securities |
215 | 150 | ||||||
| Trade accounts receivable, less allowances of $56 and $63, respectively |
3,317 | 2,587 | ||||||
| Inventories |
2,220 | 1,641 | ||||||
| Prepaid expenses and other assets |
2,260 | 1,623 | ||||||
| TOTAL CURRENT ASSETS |
12,105 | 8,441 | ||||||
| INVESTMENTS |
||||||||
| Equity method investments: |
||||||||
| Coca-Cola Enterprises Inc. |
1,637 | 1,312 | ||||||
| Coca-Cola Hellenic Bottling Company S.A. |
1,549 | 1,251 | ||||||
| Coca-Cola FEMSA, S.A.B. de C.V. |
996 | 835 | ||||||
| Coca-Cola Amatil Limited |
806 | 817 | ||||||
| Other, principally bottling companies and joint ventures |
2,301 | 2,095 | ||||||
| Cost method investments, principally bottling companies |
488 | 473 | ||||||
| TOTAL INVESTMENTS |
7,777 | 6,783 | ||||||
| OTHER ASSETS |
2,675 | 2,701 | ||||||
| PROPERTY, PLANT AND EQUIPMENTnet |
8,493 | 6,903 | ||||||
| TRADEMARKS WITH INDEFINITE LIVES |
5,153 | 2,045 | ||||||
| GOODWILL |
4,256 | 1,403 | ||||||
| OTHER INTANGIBLE ASSETS |
2,810 | 1,687 | ||||||
| TOTAL ASSETS |
$ | 43,269 | $ | 29,963 | ||||
| LIABILITIES AND SHAREOWNERS EQUITY |
||||||||
| CURRENT LIABILITIES |
||||||||
| Accounts payable and accrued expenses |
$ | 6,915 | $ | 5,055 | ||||
| Loans and notes payable |
5,919 | 3,235 | ||||||
| Current maturities of long-term debt |
133 | 33 | ||||||
| Accrued income taxes |
258 | 567 | ||||||
| TOTAL CURRENT LIABILITIES |
13,225 | 8,890 | ||||||
| LONG-TERM DEBT |
3,277 | 1,314 | ||||||
| OTHER LIABILITIES |
3,133 | 2,231 | ||||||
| DEFERRED INCOME TAXES |
1,890 | 608 | ||||||
| SHAREOWNERS EQUITY |
||||||||
| Common stock, $0.25 par value; Authorized5,600 shares; |
880 | 878 | ||||||
| Capital surplus |
7,378 | 5,983 | ||||||
| Reinvested earnings |
36,235 | 33,468 | ||||||
| Accumulated other comprehensive income (loss) |
626 | (1,291 | ) | |||||
| Treasury stock, at cost1,201 and 1,193 shares, respectively |
(23,375 | ) | (22,118 | ) | ||||
| TOTAL SHAREOWNERS EQUITY |
21,744 | 16,920 | ||||||
| TOTAL LIABILITIES AND SHAREOWNERS EQUITY |
$ | 43,269 | $ | 29,963 | ||||
Refer to Notes to Consolidated Financial Statements.
67
Table of Contents
THE COCA-COLA COMPANY AND SUBSIDIARIES
CONSOLIDATED STATEMENTS OF CASH FLOWS
| Year Ended December 31, | 2007 | 2006 | 2005 | |||||||||
| (In millions) | ||||||||||||
| OPERATING ACTIVITIES |
||||||||||||
| Net income |
$ | 5,981 | $ | 5,080 | $ | 4,872 | ||||||
| Depreciation and amortization |
1,163 | 938 | 932 | |||||||||
| Stock-based compensation expense |
313 | 324 | 324 | |||||||||
| Deferred income taxes |
109 | (35 | ) | (88 | ) | |||||||
| Equity income or loss, net of dividends |
(452 | ) | 124 | (446 | ) | |||||||
| Foreign currency adjustments |
9 | 52 | 47 | |||||||||
| Gains on issuances of stock by equity investees |
| | (23 | ) | ||||||||
| Gains on sales of assets, including bottling interests |
(244 | ) | (303 | ) | (9 | ) | ||||||
| Other operating charges |
166 | 159 | 85 | |||||||||
| Other items |
99 | 233 | 299 | |||||||||
| Net change in operating assets and liabilities |
6 | (615 | ) | 430 | ||||||||
| Net cash provided by operating activities |
7,150 | 5,957 | 6,423 | |||||||||
| INVESTING ACTIVITIES |
||||||||||||
| Acquisitions and investments, principally |
(5,653 | ) | (901 | ) | (637 | ) | ||||||
| Purchases of other investments |
(99 | ) | (82 | ) | (53 | ) | ||||||
| Proceeds from disposals of other investments |
448 | 640 | 33 | |||||||||
| Purchases of property, plant and equipment |
(1,648 | ) | (1,407 | ) | (899 | ) | ||||||
| Proceeds from disposals of property, plant and equipment |
239 | 112 | 88 | |||||||||
| Other investing activities |
(6 | ) | (62 | ) | (28 | ) | ||||||
| Net cash used in investing activities |
(6,719 | ) | (1,700 | ) | (1,496 | ) | ||||||
| FINANCING ACTIVITIES |
||||||||||||
| Issuances of debt |
9,979 | 617 | 178 | |||||||||
| Payments of debt |
(5,638 | ) | (2,021 | ) | (2,460 | ) | ||||||
| Issuances of stock |
1,619 | 148 | 230 | |||||||||
| Purchases of stock for treasury |
(1,838 | ) | (2,416 | ) | (2,055 | ) | ||||||
| Dividends |
(3,149 | ) | (2,911 | ) | (2,678 | ) | ||||||
| Net cash provided by (used in) financing activities |
973 | (6,583 | ) | (6,785 | ) | |||||||
| EFFECT OF EXCHANGE RATE CHANGES ON CASH AND CASH EQUIVALENTS |
249 | 65 | (148 | ) | ||||||||
| CASH AND CASH EQUIVALENTS |
||||||||||||
| Net increase (decrease) during the year |
1,653 | (2,261 | ) | (2,006 | ) | |||||||
| Balance at beginning of year |
2,440 | 4,701 | 6,707 | |||||||||
| Balance at end of year |
$ | 4,093 | $ | 2,440 | $ | 4,701 | ||||||
Refer to Notes to Consolidated Financial Statements.
68
Table of Contents
THE COCA-COLA COMPANY AND SUBSIDIARIES
CONSOLIDATED STATEMENTS OF SHAREOWNERS EQUITY
| Year Ended December 31, | 2007 | 2006 | 2005 | |||||||||
| (In millions except per share data) | ||||||||||||
| NUMBER OF COMMON SHARES OUTSTANDING |
||||||||||||
| Balance at beginning of year |
2,318 | 2,369 | 2,409 | |||||||||
| Stock issued to employees exercising stock options |
8 | 4 | 7 | |||||||||
| Purchases of stock for treasury1 |
(35 | ) | (55 | ) | (47 | ) | ||||||
| Treasury stock issued to employees exercising stock options |
23 | | | |||||||||
| Treasury stock issued to former shareholders of glacéau |
4 | | | |||||||||
| Balance at end of year |
2,318 | 2,318 | 2,369 | |||||||||
| COMMON STOCK |
||||||||||||
| Balance at beginning of year |
$ | 878 | $ | 877 | $ | 875 | ||||||
| Stock issued to employees exercising stock options |
2 | 1 | 2 | |||||||||
| Balance at end of year |
880 | 878 | 877 | |||||||||
| CAPITAL SURPLUS |
||||||||||||
| Balance at beginning of year |
5,983 | 5,492 | 4,928 | |||||||||
| Stock issued to employees exercising stock options |
1,001 | 164 | 229 | |||||||||
| Tax (charge) benefit from employees stock option and restricted stock plans |
(28 | ) | 3 | 11 | ||||||||
| Stock-based compensation |
309 | 324 | 324 | |||||||||
| Stock purchased by former shareholders of glacéau |
113 | | | |||||||||
| Balance at end of year |
7,378 | 5,983 | 5,492 | |||||||||
| REINVESTED EARNINGS |
||||||||||||
| Balance at beginning of year |
33,468 | 31,299 | 29,105 | |||||||||
| Adjustment for the cumulative effect on prior years of the adoption of Interpretation No. 48 |
(65 | ) | | | ||||||||
| Net income |
5,981 | 5,080 | 4,872 | |||||||||
| Dividends (per share$1.36, $1.24 and $1.12 in 2007, 2006 and 2005, respectively) |
(3,149 | ) | (2,911 | ) | (2,678 | ) | ||||||
| Balance at end of year |
36,235 | 33,468 | 31,299 | |||||||||
| ACCUMULATED OTHER COMPREHENSIVE INCOME (LOSS) |
||||||||||||
| Balance at beginning of year |
(1,291 | ) | (1,669 | ) | (1,348 | ) | ||||||
| Net foreign currency translation adjustment |
1,575 | 603 | (396 | ) | ||||||||
| Net gain (loss) on derivatives |
(64 | ) | (26 | ) | 57 | |||||||
| Net change in unrealized gain on available-for-sale securities |
14 | 43 | 13 | |||||||||
| Net change in pension liability |
392 | | | |||||||||
| Net change in pension liability, prior to adoption of SFAS No. 158 |
| 46 | 5 | |||||||||
| Net other comprehensive income adjustments |
1,917 | 666 | (321 | ) | ||||||||
| Adjustment to initially apply SFAS No. 158 |
| (288 | ) | | ||||||||
| Balance at end of year |
626 | (1,291 | ) | (1,669 | ) | |||||||
| TREASURY STOCK |
||||||||||||
| Balance at beginning of year |
(22,118 | ) | (19,644 | ) | (17,625 | ) | ||||||
| Stock issued to employees exercising stock options |
428 | | | |||||||||
| Stock purchased by former shareholders of glacéau |
66 | | | |||||||||
| Purchases of treasury stock |
(1,751 | ) | (2,474 | ) | (2,019 | ) | ||||||
| Balance at end of year |
(23,375 | ) | (22,118 | ) | (19,644 | ) | ||||||
| TOTAL SHAREOWNERS EQUITY |
$ | 21,744 | $ | 16,920 | $ | 16,355 | ||||||
| COMPREHENSIVE INCOME |
||||||||||||
| Net income |
$ | 5,981 | $ | 5,080 | $ | 4,872 | ||||||
| Net other comprehensive income adjustments |
1,917 | 666 | (321 | ) | ||||||||
| TOTAL COMPREHENSIVE INCOME |
$ | 7,898 | $ | 5,746 | $ | 4,551 | ||||||
| 1 |
Common stock purchased from employees exercising stock options numbered approximately zero shares, zero shares and 0.5 million shares for the years ended December 31, 2007, 2006 and 2005, respectively. |
Refer to Notes to Consolidated Financial Statements.
69
Table of Contents
THE COCA-COLA COMPANY AND SUBSIDIARIES
NOTES TO CONSOLIDATED FINANCIAL STATEMENTS
NOTE 1: BUSINESS AND SUMMARY OF SIGNIFICANT ACCOUNTING POLICIES
Description of Business
The Coca-Cola Company is predominantly a manufacturer, distributor and marketer of nonalcoholic beverage concentrates and syrups. We also manufacture, distribute and market finished beverages. In these notes, the terms Company, we, us or our mean The Coca-Cola Company and all subsidiaries included in the consolidated financial statements. We primarily sell concentrates and syrups, as well as finished beverages, to bottling and canning operations, distributors, fountain wholesalers and fountain retailers. Our Company owns or licenses more than 450 brands, including Coca-Cola, Diet Coke, Fanta and Sprite, and a variety of diet and light beverages, waters, enhanced waters, juices and juice drinks, teas, coffees, and energy and sports drinks. Additionally, we have ownership interests in numerous beverage joint ventures, bottling and canning operations. Significant markets for our products exist in all the worlds geographic regions.
Basis of Presentation and Consolidation
Our consolidated financial statements are prepared in accordance with accounting principles generally accepted in the United States. Our Company consolidates all entities that we control by ownership of a majority voting interest as well as variable interest entities for which our Company is the primary beneficiary. Refer to the heading Variable Interest Entities, below, for a discussion of variable interest entities.
We use the equity method to account for our investments for which we have the ability to exercise significant influence over operating and financial policies. Consolidated net income includes our Companys proportionate share of the net income or net loss of these companies.
We use the cost method to account for our investments in companies that we do not control and for which we do not have the ability to exercise significant influence over operating and financial policies. In accordance with the cost method, these investments are recorded at cost or fair value, as appropriate.
We eliminate from our financial results all significant intercompany transactions, including the intercompany transactions with variable interest entities and the intercompany portion of transactions with equity method investees.
Certain amounts in the prior years consolidated financial statements and notes have been revised to conform to the current-year presentation.
Variable Interest Entities
Financial Accounting Standards Board (FASB) Interpretation No. 46 (revised December 2003), Consolidation of Variable Interest Entities (Interpretation No. 46(R)) addresses the consolidation of business enterprises to which the usual condition (ownership of a majority voting interest) of consolidation does not apply. Interpretation No. 46(R) focuses on controlling financial interests that may be achieved through arrangements that do not involve voting interests. It concludes that in the absence of clear control through voting interests, a companys exposure (variable interest) to the economic risks and potential rewards from the variable interest entitys assets and activities is the best evidence of control. If an enterprise holds a majority of the variable interests of an entity, it would be considered the primary beneficiary. Upon consolidation, the primary beneficiary is generally required to include assets, liabilities and noncontrolling interests at fair value and subsequently account for the variable interest as if it were consolidated based on majority voting interest.
Our consolidated balance sheets include the assets and liabilities of the following:
| | all entities in which the Company has ownership of a majority of voting interests; and |
| | all variable interest entities for which we are the primary beneficiary. |
70
Table of Contents
THE COCA-COLA COMPANY AND SUBSIDIARIES
NOTES TO CONSOLIDATED FINANCIAL STATEMENTS
NOTE 1: BUSINESS AND SUMMARY OF SIGNIFICANT ACCOUNTING POLICIES (Continued)
Our Company holds interests in certain entities, primarily bottlers, that are considered variable interest entities. These variable interests relate to profit guarantees or subordinated financial support for these entities. Our Companys investment, plus any loans and guarantees, related to these variable interest entities totaled approximately $647 million and $429 million at December 31, 2007 and 2006, respectively, representing our maximum exposures to loss. Any creditors of the variable interest entities do not have recourse against the general credit of the Company as a result of including these variable interest entities in our consolidated financial statements.
Use of Estimates and Assumptions
The preparation of our consolidated financial statements requires us to make estimates and assumptions that affect the reported amounts of assets, liabilities, revenues and expenses and the disclosure of contingent assets and liabilities in our consolidated financial statements and accompanying notes. Although these estimates are based on our knowledge of current events and actions we may undertake in the future, actual results may ultimately differ from estimates and assumptions.
Risks and Uncertainties
Factors that could adversely impact the Companys operations or financial results include, but are not limited to, the following: obesity concerns; water scarcity and quality; changes in the nonalcoholic beverages business environment; increased competition; inability to expand operations in developing and emerging markets; fluctuations in foreign currency exchange; interest rate increases; inability to maintain good relationships with our bottling partners; a deterioration in our bottling partners financial condition; strikes or work stoppages (including at key manufacturing locations); increased cost of energy; increased cost, disruption of supply or shortage of raw and packaging materials; changes in laws and regulations relating to our business, including those regarding beverage containers and packaging; additional labeling or warning requirements; unfavorable economic and political conditions in the United States and international markets; changes in commercial and market practices within the European Economic Area; litigation or legal proceedings; adverse weather conditions; an inability to maintain brand image and product issues such as product recalls; changes in the legal and regulatory environment in various countries in which we operate; changes in accounting and taxation standards, including an increase in tax rates; an inability to achieve our overall long-term goals; an inability to protect our information systems; future impairment charges; an inability to successfully manage our Company-owned bottling operations; and global or regional catastrophic events.
Our Company monitors our operations with a view to minimizing the impact to our overall business that could arise as a result of the risks and uncertainties inherent in our business.
Revenue Recognition
Our Company recognizes revenue when persuasive evidence of an arrangement exists, delivery of products has occurred, the sales price charged is fixed or determinable, and collectibility is reasonably assured. For our Company, this generally means that we recognize revenue when title to our products is transferred to our bottling partners, resellers or other customers. In particular, title usually transfers upon shipment to or receipt at our customers locations, as determined by the specific sales terms of the transactions. Our sales terms do not allow for a right of return except for matters related to any manufacturing defects on our part.
In addition, our customers can earn certain incentives, which are included in deductions from revenue, a component of net operating revenues in the consolidated statements of income. These incentives include, but are not
71
Table of Contents
THE COCA-COLA COMPANY AND SUBSIDIARIES
NOTES TO CONSOLIDATED FINANCIAL STATEMENTS
NOTE 1: BUSINESS AND SUMMARY OF SIGNIFICANT ACCOUNTING POLICIES (Continued)
limited to, cash discounts, funds for promotional and marketing activities, volume-based incentive programs and support for infrastructure programs (refer to the heading Other Assets). The aggregate deductions from revenue recorded by the Company in relation to these programs, including amortization expense on infrastructure initiatives, was approximately $4.1 billion, $3.8 billion and $3.7 billion for the years ended December 31, 2007, 2006 and 2005, respectively.
Advertising Costs
Our Company expenses production costs of print, radio, television and other advertisements as of the first date the advertisements take place. Advertising costs included in selling, general and administrative expenses were approximately $2.8 billion, $2.6 billion and $2.5 billion for the years ended December 31, 2007, 2006 and 2005, respectively. As of December 31, 2007 and 2006, advertising and production costs of approximately $224 million and $214 million, respectively, were recorded in prepaid expenses and other assets in our consolidated balance sheets.
Stock-Based Compensation
Our Company currently sponsors stock option plans and restricted stock award plans. Refer to Note 15. Prior to January 1, 2006, the Company accounted for these plans under the fair value recognition and measurement provisions of Statement of Financial Accounting Standards (SFAS) No. 123, Accounting for Stock-Based Compensation. Effective January 1, 2006, the Company adopted SFAS No. 123 (revised 2004), Share Based Payment (SFAS No. 123(R)). Our Company adopted SFAS No. 123(R) using the modified prospective method. Based on the terms of our plans, our Company did not have a cumulative effect related to our plans. The adoption of SFAS No. 123(R) did not have a material impact on our stock-based compensation expense for the year ended December 31, 2006. The fair values of the stock awards are determined using an estimated expected life. The Company recognizes compensation expense on a straight-line basis over the period the award is earned by the employee.
Our equity method investees also adopted SFAS No. 123(R) effective January 1, 2006. Our proportionate share of the stock-based compensation expense resulting from the adoption of SFAS No. 123(R) by our equity method investees is recognized as a reduction of equity income. The adoption of SFAS No. 123(R) by our equity method investees did not have a material impact on our consolidated financial statements.
Issuances of Stock by Equity Method Investees
When one of our equity method investees issues additional shares to third parties, our percentage ownership interest in the investee decreases. In the event the issuance price per share is higher or lower than our average carrying amount per share, we recognize a noncash gain or loss on the issuance. This noncash gain or loss, net of any deferred taxes, is generally recognized in our net income in the period the change in ownership interest occurs.
If gains or losses have been previously recognized on issuances of an equity method investees stock and shares of the equity method investee are subsequently repurchased by the equity method investee, gain or loss recognition does not occur on issuances subsequent to the date of a repurchase until shares have been issued in an amount equivalent to the number of repurchased shares. This type of transaction is reflected as an equity transaction, and the net effect is reflected in our consolidated balance sheets. Refer to Note 4.
Income Taxes
Income tax expense includes United States, state, local and international income taxes, plus a provision for U.S. taxes on undistributed earnings of foreign subsidiaries not deemed to be indefinitely reinvested. Deferred tax assets and liabilities are recognized for the tax consequences of temporary differences between the financial reporting and the tax
72
Table of Contents
THE COCA-COLA COMPANY AND SUBSIDIARIES
NOTES TO CONSOLIDATED FINANCIAL STATEMENTS
NOTE 1: BUSINESS AND SUMMARY OF SIGNIFICANT ACCOUNTING POLICIES (Continued)
basis of existing assets and liabilities. The tax rate used to determine the deferred tax assets and liabilities is the enacted tax rate for the year in which the differences are expected to reverse. Valuation allowances are recorded to reduce deferred tax assets to the amount that will more likely than not be realized. On January 1, 2007, the Company adopted FASB Interpretation No. 48, Accounting for Uncertainty in Income Taxes (Interpretation No. 48) to account for uncertainty in income taxes recognized in the Companys financial statements in accordance with SFAS No. 109, Accounting for Income Taxes. Refer to Note 17.
Net Income Per Share
Basic net income per share is computed by dividing net income by the weighted average number of common shares outstanding during the reporting period. Diluted net income per share is computed similarly to basic net income per share, except that it includes the potential dilution that could occur if dilutive securities were exercised. Approximately 71 million, 175 million and 180 million stock option awards were excluded from the computations of diluted net income per share in 2007, 2006 and 2005, respectively, because the awards would have been antidilutive for the periods presented.
Cash Equivalents
We classify marketable securities that are highly liquid and have maturities of three months or less at the date of purchase as cash equivalents. We manage our exposure to counterparty credit risk through specific minimum credit standards, diversification of counterparties and procedures to monitor our credit risk concentrations.
Trade Accounts Receivable
We record trade accounts receivable at net realizable value. This value includes an appropriate allowance for estimated uncollectible accounts to reflect any loss anticipated on the trade accounts receivable balances and charged to the provision for doubtful accounts. We calculate this allowance based on our history of write-offs, level of past-due accounts based on the contractual terms of the receivables, and our relationships with and the economic status of our bottling partners and customers.
Activity in the allowance for doubtful accounts was as follows (in millions):
| Year Ended December 31, | 2007 | 2006 | 2005 | |||||||||
| Balance, beginning of year |
$ | 63 | $ | 72 | $ | 69 | ||||||
| Net charges to costs and expenses |
17 | 2 | 17 | |||||||||
| Write-offs |
(32 | ) | (12 | ) | (12 | ) | ||||||
| Other1 |
8 | 1 | (2 | ) | ||||||||
| Balance, end of year |
$ | 56 | $ | 63 | $ | 72 | ||||||
| 1 |
Other includes acquisitions, divestitures and currency translation. |
A significant portion of our net operating revenues is derived from sales of our products in international markets. Refer to Note 21. We also generate a significant portion of our net operating revenues by selling concentrates and syrups to bottlers in which we have a noncontrolling interest, including Coca-Cola Enterprises Inc. (CCE), Coca-Cola Hellenic Bottling Company S.A. (Coca-Cola Hellenic), Coca-Cola FEMSA, S.A.B. de C.V. (Coca-Cola FEMSA) and Coca-Cola Amatil Limited (Coca-Cola Amatil). Refer to Note 3.
73
Table of Contents
THE COCA-COLA COMPANY AND SUBSIDIARIES
NOTES TO CONSOLIDATED FINANCIAL STATEMENTS
NOTE 1: BUSINESS AND SUMMARY OF SIGNIFICANT ACCOUNTING POLICIES (Continued)
Inventories
Inventories consist primarily of raw materials and packaging (which includes ingredients and supplies) and finished goods (which include concentrates and syrups in our concentrate and foodservice operations, and finished beverages in our bottling and canning operations). Inventories are valued at the lower of cost or market. We determine cost on the basis of the average cost or first-in, first-out methods. Refer to Note 2.
Recoverability of Equity Method and Cost Method Investments
Management periodically assesses the recoverability of our Companys equity method and cost method investments. For publicly traded investments, readily available quoted market prices are an indication of the fair value of our Companys investments. For nonpublicly traded investments, if an identified event or change in circumstances requires an impairment evaluation, management assesses fair value based on valuation methodologies, including discounted cash flows, estimates of sales proceeds and external appraisals, as appropriate. We consider the assumptions that we believe hypothetical marketplace participants would use in evaluating estimated future cash flows when employing the discounted cash flows and estimates of sales proceeds valuation methodologies. If an investment is considered to be impaired and the decline in value is other than temporary, we record a write-down.
Other Assets
Our Company advances payments to certain customers for marketing to fund future activities intended to generate profitable volume, and we expense such payments over the applicable period. Advance payments are also made to certain customers for distribution rights. Additionally, our Company invests in infrastructure programs with our bottlers that are directed at strengthening our bottling system and increasing unit case volume. When facts and circumstances indicate that the carrying value of the assets may not be recoverable, management evaluates the recoverability of these assets by preparing estimates of sales volume, the resulting gross profit and cash flows. If we determine that the carrying value of the assets is not recoverable, we record an impairment loss equal to the excess of the carrying amount of the assets over fair value of the assets. Costs of these programs are recorded in prepaid expenses and other assets and noncurrent other assets and are amortized over the remaining periods directly benefited, which range from 1 to 11 years. Amortization expense for infrastructure programs was approximately $151 million, $136 million and $134 million for the years ended December 31, 2007, 2006 and 2005, respectively. Refer to heading Revenue Recognition, above, and Note 3.
Property, Plant and Equipment
Property, plant and equipment are stated at cost. Repair and maintenance costs that do not improve service potential or extend economic life are expensed as incurred. Depreciation is recorded principally by the straight-line method over the estimated useful lives of our assets, which generally have the following ranges: buildings and improvements: 40 years or less; machinery and equipment: 15 years or less; containers: 10 years or less. Land is not depreciated, and construction in progress is not depreciated until ready for service and capitalized. Leasehold improvements are amortized using the straight-line method over the shorter of the remaining lease term, including renewals that are deemed to be reasonably assured, or the estimated useful life of the improvement. Depreciation expense, including the depreciation expense of assets under capital lease, totaled approximately $958 million, $763 million and $752 million for the years ended December 31, 2007, 2006 and 2005, respectively. Amortization expense for leasehold improvements totaled approximately $21 million, $21 million and $17 million for the years ended December 31, 2007, 2006 and 2005, respectively. Refer to Note 5.
Management assesses the recoverability of the carrying amount of property, plant and equipment if certain events or changes in circumstances indicate that the carrying value of such assets may not be recoverable, such as a significant
74
Table of Contents
THE COCA-COLA COMPANY AND SUBSIDIARIES
NOTES TO CONSOLIDATED FINANCIAL STATEMENTS
NOTE 1: BUSINESS AND SUMMARY OF SIGNIFICANT ACCOUNTING POLICIES (Continued)
decrease in market value of the assets or a significant change in the business conditions in a particular market. If we determine that the carrying value of an asset is not recoverable based on expected undiscounted future cash flows, excluding interest charges, we record an impairment loss equal to the excess of the carrying amount of the asset over its fair value.
Goodwill, Trademarks and Other Intangible Assets
In accordance with SFAS No. 142, Goodwill and Other Intangible Assets, we classify intangible assets into three categories: (1) intangible assets with definite lives subject to amortization, (2) intangible assets with indefinite lives not subject to amortization, and (3) goodwill. We test intangible assets with definite lives for impairment if conditions exist that indicate the carrying value may not be recoverable. Such conditions may include an economic downturn in a geographic market or a change in the assessment of future operations. We record an impairment charge when the carrying value of the definite-lived intangible asset is not recoverable by the cash flows generated from the use of the asset.
Intangible assets with indefinite lives and goodwill are not amortized. We test these intangible assets and goodwill for impairment at least annually or more frequently if events or circumstances indicate that such intangible assets or goodwill might be impaired. Such tests for impairment are also required for intangible assets with indefinite lives and/or goodwill recorded by our equity method investees. All goodwill is assigned to reporting units, which are one level below our operating segments. Goodwill is assigned to the reporting unit that benefits from the synergies arising from each business combination. We perform our impairment tests of goodwill at our reporting unit level. Such impairment tests for goodwill include comparing the fair value of the respective reporting unit with its carrying value, including goodwill. We use a variety of methodologies in conducting these impairment tests, including discounted cash flow analyses with a number of scenarios, where applicable, that are weighted based on the probability of different outcomes. When appropriate, we consider the assumptions that we believe hypothetical marketplace participants would use in estimating future cash flows. In addition, where applicable, an appropriate discount rate is used, based on the Companys cost of capital rate or location-specific economic factors. When the fair value is less than the carrying value of the intangible assets or the reporting unit, we record an impairment charge to reduce the carrying value of the assets to fair value. These impairment charges are generally recorded in the line item other operating charges or, to the extent they relate to equity method investees, as a reduction of equity incomenet, in the consolidated statements of income.
Our Company determines the useful lives of our identifiable intangible assets after considering the specific facts and circumstances related to each intangible asset. Factors we consider when determining useful lives include the contractual term of any agreement, the history of the asset, the Companys long-term strategy for the use of the asset, any laws or other local regulations which could impact the useful life of the asset, and other economic factors, including competition and specific market conditions. Intangible assets that are deemed to have definite lives are amortized, primarily on a straight-line basis, over their useful lives, generally ranging from 1 to 20 years. Refer to Note 6.
Derivative Financial Instruments
Our Company accounts for derivative financial instruments in accordance with SFAS No. 133, Accounting for Derivative Instruments and Hedging Activities, as amended by SFAS No. 137, Accounting for Derivative Instruments and Hedging ActivitiesDeferral of the Effective Date of FASB Statement No. 133an amendment of FASB Statement No. 133, SFAS No. 138, Accounting for Certain Derivative Instruments and Certain Hedging Activitiesan amendment of FASB Statement No. 133, and SFAS No. 149, Amendment of Statement 133 on Derivative Instruments and Hedging Activities. We recognize all derivative instruments as either assets or liabilities at
75
Table of Contents
THE COCA-COLA COMPANY AND SUBSIDIARIES
NOTES TO CONSOLIDATED FINANCIAL STATEMENTS
NOTE 1: BUSINESS AND SUMMARY OF SIGNIFICANT ACCOUNTING POLICIES (Continued)
fair value in our consolidated balance sheets, with fair values of foreign currency derivatives estimated based on quoted market prices or pricing models using current market rates. Cash flows from derivative instruments designated as net investment hedges are classified as investing activities. Cash flows from other derivative instruments used to manage interest, commodity or currency exposures are classified as operating activities. Refer to Note 12.
Retirement-Related Benefits
Using appropriate actuarial methods and assumptions, our Company accounts for defined benefit pension plans in accordance with SFAS No. 87, Employers Accounting for Pensions, and we account for our nonpension postretirement benefits in accordance with SFAS No. 106, Employers Accounting for Postretirement Benefits Other Than Pensions, as amended by SFAS No. 158, Employers Accounting for Defined Benefit Pension and Other Postretirement Plansan amendment of FASB Statements No. 87, 88, 106, and 132(R). Effective December 31, 2006 for our Company, SFAS No. 158 required that previously unrecognized actuarial gains or losses, prior service costs or credits and transition obligations or assets be recognized generally through adjustments to accumulated other comprehensive income and credits to prepaid benefit cost or accrued benefit liability. As a result of these adjustments, the current funded status of defined benefit pension plans and other postretirement benefit plans is reflected in the Companys consolidated balance sheets as of December 31, 2007 and 2006. Refer to Note 16.
Our equity method investees also adopted SFAS No. 158 effective December 31, 2006. Refer to Note 3 for the impact on our consolidated balance sheet resulting from the adoption of SFAS No. 158 by our equity method investees.
Contingencies
Our Company is involved in various legal proceedings and tax matters. Due to their nature, such legal proceedings and tax matters involve inherent uncertainties including, but not limited to, court rulings, negotiations between affected parties and governmental actions. Management assesses the probability of loss for such contingencies and accrues a liability and/or discloses the relevant circumstances, as appropriate. Refer to Note 13.
Business Combinations
In accordance with SFAS No. 141, Business Combinations, we account for all business combinations by the purchase method. Furthermore, we recognize intangible assets apart from goodwill if they arise from contractual or legal rights or if they are separable from goodwill.
Recent Accounting Standards and Pronouncements
In December 2007, the FASB issued SFAS No. 141 (revised 2007), Business Combinations. SFAS No. 141(R) amends the principles and requirements for how an acquirer recognizes and measures in its financial statements the identifiable assets acquired, the liabilities assumed, any noncontrolling interest in the acquiree and the goodwill acquired. SFAS No. 141(R) also establishes disclosure requirements to enable the evaluation of the nature and financial effects of the business combination. SFAS No. 141(R) is effective for our Company on January 1, 2009, and the Company will apply prospectively to all business combinations subsequent to the effective date.
In December 2007, the FASB issued SFAS No. 160, Noncontrolling Interests in Consolidated Financial Statementsan amendment of Accounting Research Bulletin No. 51. SFAS No. 160 establishes accounting and reporting standards for the noncontrolling interest in a subsidiary and for the deconsolidation of a subsidiary. SFAS
76
Table of Contents
THE COCA-COLA COMPANY AND SUBSIDIARIES
NOTES TO CONSOLIDATED FINANCIAL STATEMENTS
NOTE 1: BUSINESS AND SUMMARY OF SIGNIFICANT ACCOUNTING POLICIES (Continued)
No. 160 also establishes disclosure requirements that clearly identify and distinguish between the controlling and noncontrolling interests and requires the separate disclosure of income attributable to controlling and noncontrolling interests. SFAS No. 160 is effective for fiscal years beginning after December 15, 2008. The Company is currently evaluating the impact that the adoption of SFAS No. 160 will have on our consolidated financial statements.
In February 2007, the FASB issued SFAS No. 159, The Fair Value Option for Financial Assets and Financial LiabilitiesIncluding an amendment of FASB Statement No. 115. SFAS No. 159 permits entities to choose to measure many financial instruments and certain other items at fair value. Unrealized gains and losses on items for which the fair value option has been elected will be recognized in earnings at each subsequent reporting date. SFAS No. 159 was effective for our Company on January 1, 2008. The adoption of SFAS No. 159 did not have a material impact on our consolidated financial statements.
In September 2006, the SEC staff published SAB No. 108, Considering the Effects of Prior Year Misstatements when Quantifying Misstatements in Current Year Financial Statements. SAB No. 108 addresses quantifying the financial statement effects of misstatements, specifically, how the effects of prior year uncorrected errors must be considered in quantifying misstatements in the current year financial statements. SAB No. 108 was effective for fiscal years ending after November 15, 2006. The adoption of SAB No. 108 by our Company in the fourth quarter of 2006 did not have a material impact on our consolidated financial statements.
As previously discussed, our Company adopted SFAS No. 158 related to defined benefit pension and other postretirement plans. Refer to Note 16.
In September 2006, the FASB issued SFAS No. 157, Fair Value Measurements. SFAS No. 157 defines fair value, establishes a framework for measuring fair value and expands disclosure requirements about fair value measurements. SFAS No. 157 was effective for our Company on January 1, 2008. However, in February 2008, the FASB released a FASB Staff Position (FSP FAS 157-2Effective Date of FASB Statement No. 157 ) which delayed the effective date of SFAS No. 157 for all nonfinancial assets and nonfinancial liabilities, except those that are recognized or disclosed at fair value in the financial statements on a recurring basis (at least annually). The adoption of SFAS No. 157 for our financial assets and liabilities did not have a material impact upon adoption. We do not believe the adoption of SFAS No. 157 for our non-financial assets and liabilities, effective January 1, 2009, will have a material impact on our consolidated financial statements.
In July 2006, the FASB issued Interpretation No. 48 which clarifies the accounting for uncertainty in income taxes recognized in an enterprises financial statements in accordance with SFAS No. 109, Accounting for Income Taxes. Interpretation No. 48 prescribes a recognition threshold and measurement attribute for the financial statement recognition and measurement of a tax position taken or expected to be taken in a tax return. Interpretation No. 48 also provides guidance on derecognition, classification, interest and penalties, accounting in interim periods, disclosure and transition. For our Company, Interpretation No. 48 was effective January 1, 2007. As a result of the adoption of Interpretation No. 48, we recorded an approximate $65 million increase in accrued income taxes in our consolidated balance sheet for unrecognized tax benefits, which was accounted for as a cumulative effect adjustment to the January 1, 2007 balance of reinvested earnings. Refer to Note 17.
In May 2005, the FASB issued SFAS No. 154, Accounting Changes and Error Corrections, a replacement of Accounting Principles Board (APB) Opinion No. 20 and FASB Statement No. 3. SFAS No. 154 requires retrospective application to prior periods financial statements of a voluntary change in accounting principle unless it is impracticable. APB Opinion No. 20, Accounting Changes, previously required that most voluntary changes in
77
Table of Contents
THE COCA-COLA COMPANY AND SUBSIDIARIES
NOTES TO CONSOLIDATED FINANCIAL STATEMENTS
NOTE 1: BUSINESS AND SUMMARY OF SIGNIFICANT ACCOUNTING POLICIES (Continued)
accounting principle be recognized by including in net income of the period of the change the cumulative effect of changing to the new accounting principle. SFAS No. 154 became effective for our Company on January 1, 2006. The adoption of SFAS No. 154 did not have a material impact on our consolidated financial statements.
In December 2004, the FASB issued SFAS No. 153, Exchanges of Nonmonetary Assets, an amendment of APB Opinion No. 29. SFAS No. 153 is based on the principle that exchanges of nonmonetary assets should be measured based on the fair value of the assets exchanged. APB Opinion No. 29, Accounting for Nonmonetary Transactions, provided an exception to its basic measurement principle (fair value) for exchanges of similar productive assets. Under APB Opinion No. 29, an exchange of a productive asset for a similar productive asset was based on the recorded amount of the asset relinquished. SFAS No. 153 eliminates this exception and replaces it with an exception for exchanges of nonmonetary assets that do not have commercial substance. SFAS No. 153 became effective for our Company as of July 2, 2005, and did not have a material impact on our consolidated financial statements.
As previously discussed, our Company adopted SFAS No. 123(R) related to share based payments effective January 1, 2006. Refer to Note 15.
In November 2004, the FASB issued SFAS No. 151, Inventory Costs, an amendment of Accounting Research Bulletin No. 43, Chapter 4. SFAS No. 151 requires that abnormal amounts of idle facility expense, freight, handling costs and wasted materials (spoilage) be recorded as current period charges and that the allocation of fixed production overheads to inventory be based on the normal capacity of the production facilities. The Company adopted SFAS No. 151 on January 1, 2006. The adoption of SFAS No. 151 did not have a material impact on our consolidated financial statements.
In October 2004, the American Jobs Creation Act of 2004 (the Jobs Creation Act) was signed into law. The Jobs Creation Act included a temporary incentive for U.S. multinationals to repatriate foreign earnings at an approximate 5.25 percent effective tax rate. Issued in December 2004, FASB Staff Position 109-2, Accounting and Disclosure Guidance for the Foreign Earnings Repatriation Provision within the American Jobs Creation Act of 2004 indicated that the lack of clarification of certain provisions within the Jobs Creation Act and the timing of the enactment necessitated a practical exception to the SFAS No. 109, Accounting for Income Taxes, requirement to reflect in the period of enactment the effect of a new tax law. Accordingly, enterprises were allowed time beyond 2004 to evaluate the effect of the Jobs Creation Act on their plans for reinvestment or repatriation of foreign earnings for purposes of applying SFAS No. 109. Accordingly, in 2005, the Company repatriated $6.1 billion of its previously unremitted earnings and recorded an associated tax expense of approximately $315 million. Refer to Note 17.
NOTE 2: INVENTORIES
Inventories consisted of the following (in millions):
| December 31, | 2007 | 2006 | ||||
| Raw materials and packaging |
$ | 1,199 | $ | 923 | ||
| Finished goods |
789 | 548 | ||||
| Other |
232 | 170 | ||||
| Inventories |
$ | 2,220 | $ | 1,641 | ||
78
Table of Contents
THE COCA-COLA COMPANY AND SUBSIDIARIES
NOTES TO CONSOLIDATED FINANCIAL STATEMENTS
NOTE 3: BOTTLING INVESTMENTS
Coca-Cola Enterprises Inc.
CCE is a marketer, producer and distributor of bottle and can nonalcoholic beverages, operating in eight countries. As of December 31, 2007, our Company owned approximately 35 percent of the outstanding common stock of CCE. We account for our investment by the equity method of accounting and, therefore, our net income includes our proportionate share of income resulting from our investment in CCE. As of December 31, 2007, our proportionate share of the net assets of CCE exceeded our investment by approximately $337 million. This difference is not amortized.
A summary of financial information for CCE is as follows (in millions):
| Year Ended December 31, | 2007 | 2006 | 2005 | |||||||
| Net operating revenues |
$ | 20,936 | $ | 19,804 | $ | 18,743 | ||||
| Cost of goods sold |
12,955 | 12,067 | 11,258 | |||||||
| Gross profit |
$ | 7,981 | $ | 7,737 | $ | 7,485 | ||||
| Operating income (loss) |
$ | 1,470 | $ | (1,495 | ) | $ | 1,431 | |||
| Net income (loss) |
$ | 711 | $ | (1,143 | ) | $ | 514 | |||
| December 31, | 2007 | 2006 | ||||||||
| Current assets |
$ | 4,092 | $ | 3,802 | ||||||
| Noncurrent assets |
19,954 | 19,564 | ||||||||
| Total assets |
$ | 24,046 | $ | 23,366 | ||||||
| Current liabilities |
$ | 5,343 | $ | 3,924 | ||||||
| Noncurrent liabilities |
13,014 | 14,916 | ||||||||
| Total liabilities |
$ | 18,357 | $ | 18,840 | ||||||
| Shareowners equity |
$ | 5,689 | $ | 4,526 | ||||||
| Company equity investment |
$ | 1,637 | $ | 1,312 | ||||||
A summary of our significant transactions with CCE is as follows (in millions):
| Year Ended December 31, | 2007 | 2006 | 2005 | ||||||
| Concentrate, syrup and finished product sales to CCE |
$ | 5,948 | $ | 5,378 | $ | 5,125 | |||
| Syrup and finished product purchases from CCE |
410 | 415 | 428 | ||||||
| CCE purchases of sweeteners through our Company |
326 | 274 | 275 | ||||||
| Marketing payments made by us directly to CCE |
636 | 514 | 482 | ||||||
| Marketing payments made to third parties on behalf of CCE |
123 | 113 | 136 | ||||||
| Local media and marketing program reimbursements from CCE |
299 | 279 | 245 | ||||||
| Payments made to CCE for dispensing equipment repair services |
78 | 74 | 70 | ||||||
| Other paymentsnet |
102 | 99 | 81 | ||||||
Syrup and finished product purchases from CCE represent purchases of fountain syrup in certain territories that have been resold by our Company to major customers and purchases of bottle and can products. Marketing payments made by us directly to CCE represent support of certain marketing activities and our participation with CCE in cooperative advertising and other marketing activities to promote the sale of Company trademark products within CCE
79
Table of Contents
THE COCA-COLA COMPANY AND SUBSIDIARIES
NOTES TO CONSOLIDATED FINANCIAL STATEMENTS
NOTE 3: BOTTLING INVESTMENTS (Continued)
territories. These programs are agreed to on an annual basis. Marketing payments made to third parties on behalf of CCE represent support of certain marketing activities and programs to promote the sale of Company trademark products within CCEs territories in conjunction with certain of CCEs customers. Pursuant to cooperative advertising and trade agreements with CCE, we received funds from CCE for local media and marketing program reimbursements. Payments made to CCE for dispensing equipment repair services represent reimbursement to CCE for its costs of parts and labor for repairs on cooler, dispensing, or post-mix equipment owned by us or our customers. The Other paymentsnet line in the table above represents payments made to and received from CCE that are individually not significant.
In 2007, our equity income related to CCE was increased by approximately $11 million related to our proportionate share of certain items recorded by CCE. Our proportionate share of these items included an approximate $35 million increase to equity income, primarily related to tax benefits recorded by CCE. This increase was partially offset by an approximate $24 million decrease to equity income, primarily related to restructuring charges recorded by CCE. Refer to Note 19.
The Canadian Bottlers Agreements between our Company and CCE expired on January 28, 2008. We continue to operate under the terms of the expired agreements while we negotiate the terms of the new agreements.
In 2006, our Companys equity income related to CCE decreased by approximately $587 million, related to our proportionate share of certain items recorded by CCE. Our proportionate share of these items included approximately $602 million resulting from the impact of an impairment charge recorded by CCE. CCE recorded a $2.9 billion pretax ($1.8 billion after tax) impairment of its North American franchise rights. The decline in the estimated fair value of CCEs North American franchise rights was the result of several factors, including but not limited to (1) CCEs revised outlook on 2007 raw material costs driven by significant increases in aluminum and high fructose corn syrup (HFCS); (2) a challenging marketplace environment with increased pricing pressures in several high-growth beverage categories; and (3) increased interest rates contributing to a higher discount rate and corresponding capital charge. Our proportionate share of CCEs charges also included approximately $18 million due to restructuring charges recorded by CCE. These charges were partially offset by approximately $33 million related to our proportionate share of changes in certain of CCEs state and Canadian federal and provincial tax rates. All of these charges and changes impacted our Bottling Investments operating segment.
In 2005, our equity income related to CCE was reduced by approximately $33 million related to our proportionate share of certain charges and gains recorded by CCE. Our proportionate share of CCEs charges included an approximate $51 million decrease to equity income, primarily related to the tax liability recorded by CCE in the fourth quarter of 2005 resulting from the repatriation of previously unremitted foreign earnings under the Jobs Creation Act and approximately $18 million due to restructuring charges recorded by CCE. These restructuring charges were primarily related to workforce reductions associated with the reorganization of CCEs North American operations, changes in executive management and elimination of certain positions in CCEs corporate headquarters. These charges were partially offset by an approximate $37 million increase to equity income in the second quarter of 2005 resulting from CCEs HFCS lawsuit settlement proceeds and changes in certain of CCEs state and provincial tax rates. Refer to Note 19.
Our Company and CCE have established a Global Marketing Fund, under which we expect to pay CCE $62 million annually through December 31, 2014, as support for certain marketing activities. The term of the agreement will automatically be extended for successive 10-year periods thereafter unless either party gives written notice of termination of this agreement. The marketing activities to be funded under this agreement will be agreed upon
80
Table of Contents
THE COCA-COLA COMPANY AND SUBSIDIARIES
NOTES TO CONSOLIDATED FINANCIAL STATEMENTS
NOTE 3: BOTTLING INVESTMENTS (Continued)
each year as part of the annual joint planning process and will be incorporated into the annual marketing plans of both companies. These amounts are included in the line item marketing payments made by us directly to CCE in the table above.
Our Company previously entered into programs with CCE designed to help develop cold-drink infrastructure. Under these programs, our Company paid CCE for a portion of the cost of developing the infrastructure necessary to support accelerated placements of cold-drink equipment. These payments support a common objective of increased sales of Company trademarked beverages from increased availability and consumption in the cold-drink channel. In connection with these programs, CCE agreed to:
| (1) | purchase and place specified numbers of Company-approved cold-drink equipment each year through 2010; |
| (2) | maintain the equipment in service, with certain exceptions, for a period of at least 12 years after placement; |
| (3) | maintain and stock the equipment in accordance with specified standards; and |
| (4) | annual reporting to our Company of minimum average annual unit case volume throughout the economic life of the equipment and other specified information. |
CCE must achieve minimum average unit case volume for a 12-year period following the placement of equipment. These minimum average unit case volume levels ensure adequate gross profit from sales of concentrate to fully recover the capitalized costs plus a return on the Companys investment. Should CCE fail to purchase the specified numbers of cold-drink equipment for any calendar year through 2010, the parties agreed to mutually develop a reasonable solution. Should no mutually agreeable solution be developed, or in the event that CCE otherwise breaches any material obligation under the contracts and such breach is not remedied within a stated period, then CCE would be required to repay a portion of the support funding as determined by our Company. In the third quarter of 2004, our Company and CCE agreed to amend the contract to defer the placement of some equipment from 2004 and 2005, as previously agreed under the original contract, to 2009 and 2010. In connection with this amendment, CCE agreed to pay the Company approximately $2 million in 2004, $3 million annually in 2005 through 2008, and $1 million in 2009. In 2005, our Company and CCE agreed to amend the contract for North America to move to a system of purchase and placement credits, whereby CCE earns credit toward its annual purchase and placement requirements based upon the type of equipment it purchases and places. The amended contract also provides that no breach by CCE will occur even if they do not achieve the required number of purchase and placement credits in any given year, so long as (1) the shortfall does not exceed 20 percent of the required purchase and placement credits for that year; (2) a compensating payment is made to our Company by CCE; (3) the shortfall is corrected in the following year; and (4) CCE meets all specified purchase and placement credit requirements by the end of 2010. The payments we made to CCE under these programs are recorded in prepaid expenses and other assets and in noncurrent other assets and amortized as deductions from revenues over the 10-year period following the placement of the equipment. Our carrying values for these infrastructure programs with CCE were approximately $494 million and $576 million as of December 31, 2007 and 2006, respectively. The Company has no further commitments under these programs.
Effective December 31, 2006, CCE adopted SFAS No. 158. Our proportionate share of the impact of CCEs adoption of SFAS No. 158 was an approximate $132 million pretax ($84 million after tax) reduction in both the carrying value of our investment in CCE and our accumulated other comprehensive income (loss) (AOCI). Refer to Note 10 and Note 16.
If valued at the December 31, 2007 quoted closing price of CCE shares, the fair value of our investment in CCE would have exceeded our carrying value by approximately $2.8 billion.
81
Table of Contents
THE COCA-COLA COMPANY AND SUBSIDIARIES
NOTES TO CONSOLIDATED FINANCIAL STATEMENTS
NOTE 3: BOTTLING INVESTMENTS (Continued)
Other Equity Method Investments
Our other equity method investments include our ownership interests in Coca-Cola Hellenic, Coca-Cola FEMSA and Coca-Cola Amatil. As of December 31, 2007, we owned approximately 23 percent, 32 percent and 30 percent, respectively, of these companies common shares.
Operating results include our proportionate share of income (loss) from our equity method investments. As of December 31, 2007, our investment in our equity method investees in the aggregate, other than CCE, exceeded our proportionate share of the net assets of these equity method investees by approximately $1,122 million. This difference is not amortized.
A summary of financial information for our equity method investees in the aggregate, other than CCE, is as follows (in millions):
| Year Ended December 31, | 2007 | 2006 | 2005 | ||||||
| Net operating revenues |
$ | 28,112 | $ | 24,990 | $ | 24,389 | |||
| Cost of goods sold |
16,003 | 14,717 | 14,141 | ||||||
| Gross profit |
$ | 12,109 | $ | 10,273 | $ | 10,248 | |||
| Operating income |
$ | 3,369 | $ | 2,697 | $ | 2,669 | |||
| Net income (loss) |
$ | 1,868 | $ | 1,475 | $ | 1,501 | |||
| Net income (loss) available to common shareowners |
$ | 1,868 | $ | 1,455 | $ | 1,477 | |||
| December 31, | 2007 | 2006 | ||||
| Current assets |
$ | 10,159 | $ | 8,735 | ||
| Noncurrent assets |
24,682 | 21,755 | ||||
| Total assets |
$ | 34,841 | $ | 30,490 | ||
| Current liabilities |
$ | 8,587 | $ | 7,839 | ||
| Noncurrent liabilities |
10,360 | 9,777 | ||||
| Total liabilities |
$ | 18,947 | $ | 17,616 | ||
| Shareowners equity |
$ | 15,894 | $ | 12,874 | ||
| Company equity investment |
$ | 5,652 | $ | 4,998 | ||
Net sales to equity method investees other than CCE, the majority of which are located outside the United States, were approximately $8.0 billion in 2007, $7.6 billion in 2006 and $7.4 billion in 2005. Total payments, primarily marketing, made to equity method investees other than CCE were approximately $546 million, $512 million and $475 million in 2007, 2006 and 2005, respectively.
In 2007, the Company and Coca-Cola FEMSA jointly acquired Jugos del Valle, S.A.B. de C.V. (Jugos del Valle), the second largest producer of packaged juices, nectars and fruit-flavored beverages in Mexico and the largest producer of such beverages in Brazil. The total purchase price was approximately $370 million plus the assumption of approximately $85 million in debt and was split equally between the Company and Coca-Cola FEMSA. The Companys investment in Jugos del Valle is accounted for under the equity method. Equity incomenet includes
82
Table of Contents
THE COCA-COLA COMPANY AND SUBSIDIARIES
NOTES TO CONSOLIDATED FINANCIAL STATEMENTS
NOTE 3: BOTTLING INVESTMENTS (Continued)
our proportionate share of the results of Jugos del Valles operations beginning November 2007 and is included in the Latin America operating segment. Refer to Note 20.
During 2007, the Company acquired a 34 percent interest in Tokyo Coca-Cola Bottling Company (Tokyo CCBC). The Companys investment in Tokyo CCBC is accounted for under the equity method. Equity incomenet includes our proportionate share of the results of Tokyo CCBCs operations beginning July 2007 and is included in the Bottling Investments operating segment. In the third quarter of 2007, the Company also acquired an additional interest in Nordeste Refrigerantes S.A. (NORSA). After this acquisition, the Company owned approximately 60 percent of NORSA. The Company began consolidating this entity from the date we acquired the additional 11 percent interest. The combined purchase price for these third quarter acquisitions was approximately $203 million. NORSA is included in the Bottling Investments operating segment. Refer to Note 20.
In 2007, the Company sold a portion of its interest in Coca-Cola Amatil for proceeds of approximately $143 million. As a result of this transaction, we recognized a gain of approximately $73 million, which impacted the Corporate segment and was included in other income (loss)net in our consolidated statement of income. Our ownership interest in the total outstanding shares of Coca-Cola Amatil was reduced from approximately 32 percent to 30 percent. Refer to Note 19.
During 2007, the Company sold substantially all of its interest in Vonpar Refrescos S.A. (Vonpar), a bottler headquartered in Brazil. Total proceeds from the sale were approximately $238 million, and we recognized a gain on this sale of approximately $70 million, which impacted the Corporate segment and is included in other income (loss)net in our consolidated statements of income. Prior to this sale, our Company owned approximately 49 percent of Vonpars outstanding common stock and accounted for the investment using the equity method. Refer to Note 19.
In 2007, our equity income was also reduced by approximately $62 million in the Bottling Investments operating segment related to our proportionate share of an impairment recorded by Coca-Cola Amatil as a result of the sale of its bottling operations in South Korea. Refer to Note 19.
Equity income in 2007 was reduced by approximately $99 million in the Bottling Investments operating segment related to our proportionate share of asset write-downs recorded by Coca-Cola Bottlers Philippines, Inc. (CCBPI). The asset write-downs primarily related to excess and obsolete bottles and cases at CCBPI. Refer to Note 19.
In 2003, one of our Companys equity method investees, Coca-Cola FEMSA, consummated a merger with another of the Companys equity method investees, Panamerican Beverages, Inc. At the time of the merger, the Company and Fomento Economico Mexicano, S.A.B. de C.V. (FEMSA), the major shareowner of Coca-Cola FEMSA, reached an understanding under which this shareowner could purchase from our Company an amount of Coca-Cola FEMSA shares sufficient for this shareowner to regain majority ownership interest in Coca-Cola FEMSA. That understanding expired in May 2006; however, in the third quarter of 2006, the Company and the shareowner reached an agreement under which the Company would sell a number of shares representing 8 percent of the capital stock of Coca-Cola FEMSA to FEMSA. As a result of this sale, which occurred in the fourth quarter of 2006, the Company received cash proceeds of approximately $427 million and realized a gain of approximately $175 million, which was recorded in the consolidated statement of income line item other income (loss)net and impacted the Corporate operating segment. Also as a result of this sale, our ownership interest in Coca-Cola FEMSA was reduced from approximately 40 percent to approximately 32 percent. Refer to Note 19.
In 2006, our Company sold a portion of our investment in Coca-Cola Icecek A.S. (Coca-Cola Icecek), an equity method investee bottler incorporated in Turkey, in an initial public offering. Our Company received cash proceeds of
83
Table of Contents
THE COCA-COLA COMPANY AND SUBSIDIARIES
NOTES TO CONSOLIDATED FINANCIAL STATEMENTS
NOTE 3: BOTTLING INVESTMENTS (Continued)
approximately $198 million and realized a gain of approximately $123 million, which was recorded in the consolidated statement of income line item other income (loss)net and impacted the Corporate operating segment. As a result of this public offering, our Companys interest in Coca-Cola Icecek decreased from approximately 36 percent to approximately 20 percent. Refer to Note 19.
Our Company owns a 50 percent interest in Multon, a Russian juice business (Multon), which we acquired in April 2005 jointly with Coca-Cola Hellenic, for a total purchase price of approximately $501 million, split equally between the Company and Coca-Cola Hellenic. Multon produces and distributes juice products under the Dobriy, Rich, Nico and other trademarks in Russia, Ukraine and Belarus. Equity incomenet includes our proportionate share of Multons net income beginning April 20, 2005. Refer to Note 20.
Effective December 31, 2006, our equity method investees other than CCE, also adopted SFAS No. 158. Our proportionate share of the impact of the adoption of SFAS No. 158 by our equity method investees other than CCE was an approximate $18 million pretax ($12 million after tax) reduction in the carrying value of our investments in those equity method investees and our AOCI. Refer to Note 10 and Note 16.
If valued at the December 31, 2007, quoted closing prices of shares actively traded on stock markets, the value of our equity method investments in publicly traded bottlers other than CCE would have exceeded our carrying value by approximately $5.8 billion.
Net Receivables and Dividends from Equity Method Investees
The total amount of net receivables due from equity method investees, including CCE, was approximately $933 million and $857 million as of December 31, 2007 and 2006, respectively. The total amount of dividends received from equity method investees, including CCE, was approximately $216 million, $226 million and $234 million for the years ended December 31, 2007, 2006 and 2005, respectively.
NOTE 4: ISSUANCES OF STOCK BY EQUITY METHOD INVESTEES
In 2007 and 2006, our equity method investees did not issue any additional shares to third parties that resulted in our Company recording any noncash pretax gains.
In 2005, our Company recorded approximately $23 million of noncash pretax gains on issuances of stock by equity method investees. We recorded deferred taxes of approximately $8 million on these gains. These gains primarily related to an issuance of common stock by Coca-Cola Amatil, which was valued at an amount greater than the book value per share of our investment in Coca-Cola Amatil. Coca-Cola Amatil issued approximately 34 million shares of common stock with a fair value of $5.78 each in connection with the acquisition of SPC Ardmona Pty. Ltd., an Australian packaged fruit company. This issuance of common stock reduced our ownership interest in the total outstanding shares of Coca-Cola Amatil from approximately 34 percent to approximately 32 percent.
84
Table of Contents
THE COCA-COLA COMPANY AND SUBSIDIARIES
NOTES TO CONSOLIDATED FINANCIAL STATEMENTS
NOTE 5: PROPERTY, PLANT AND EQUIPMENT
The following table summarizes our property, plant and equipment (in millions):
| December 31, | 2007 | 2006 | ||||
| Land |
$ | 731 | $ | 495 | ||
| Buildings and improvements |
3,539 | 3,020 | ||||
| Machinery and equipment |
8,924 | 7,333 | ||||
| Containers |
828 | 556 | ||||
| Construction in progress |
422 | 507 | ||||
| $ | 14,444 | $ | 11,911 | |||
| Less accumulated depreciation |
5,951 | 5,008 | ||||
| Property, plant and equipmentnet1 |
$ | 8,493 | $ | 6,903 | ||
| 1 |
The increase in 2007 is primarily related to business combinations, purchases of property, plant and equipment and the effect of translation adjustments, which were partially offset by disposals. Refer to Note 20. |
NOTE 6: GOODWILL, TRADEMARKS AND OTHER INTANGIBLE ASSETS
The following tables set forth information for intangible assets subject to amortization and for intangible assets not subject to amortization (in millions):
| December 31, | 2007 | 2006 | ||||
| Amortized intangible assets (various, principally customer relationships and trademarks): |
||||||
| Gross carrying amount1 |
$ | 685 | $ | 372 | ||
| Less accumulated amortization |
192 | 174 | ||||
| Amortized intangible assetsnet |
$ | 493 | $ | 198 | ||
| Unamortized intangible assets: |
||||||
| Trademarks2 |
$ | 5,153 | $ | 2,045 | ||
| Goodwill3 |
4,256 | 1,403 | ||||
| Bottlers franchise rights4 |
2,184 | 1,359 | ||||
| Other |
133 | 130 | ||||
| Unamortized intangible assets |
$ | 11,726 | $ | 4,937 | ||
| 1 |
The increase in 2007 is primarily related to business combinations and acquisitions of trademarks with definite lives totaling approximately $333 million and the effect of translation adjustments, which were partially offset by disposals. Refer to Note 20. |
| 2 |
The increase in 2007 is primarily related to business combinations and acquisitions of trademarks and brands totaling approximately $3,075 million and the effect of translation adjustments, which were partially offset by impairment charges of approximately $2 million and disposals. Refer to Note 20. |
| 3 |
The increase in 2007 is primarily related to the acquisitions of Energy Brands, Inc., also known as glacéau, CCBPI and 18 German bottling and distribution operations, and the effect of translation adjustments. Refer to Note 20. |
| 4 |
The increase in 2007 is primarily related to the acquisitions of CCBPI, NORSA and 18 German bottling and distribution operations, and the effect of translation adjustments. Refer to Note 20. |
85
Table of Contents
THE COCA-COLA COMPANY AND SUBSIDIARIES
NOTES TO CONSOLIDATED FINANCIAL STATEMENTS
NOTE 6: GOODWILL, TRADEMARKS AND OTHER INTANGIBLE ASSETS (Continued)
Total amortization expense for intangible assets subject to amortization was approximately $33 million, $18 million and $29 million for the years ended December 31, 2007, 2006 and 2005, respectively.
Information about estimated amortization expense for intangible assets subject to amortization for the five years succeeding December 31, 2007, is as follows (in millions):
| Amortization Expense |
|||
| 2008 |
$ | 52 | |
| 2009 |
48 | ||
| 2010 |
47 | ||
| 2011 |
44 | ||
| 2012 |
40 | ||
Goodwill by operating segment was as follows (in millions):
| December 31, | 2007 | 2006 | ||||
| Africa |
$ | | $ | | ||
| Eurasia |
36 | 14 | ||||
| European Union |
780 | 696 | ||||
| Latin America |
207 | 119 | ||||
| North America |
2,412 | 141 | ||||
| Pacific |
30 | 29 | ||||
| Bottling Investments |
791 | 404 | ||||
| $ | 4,256 | $ | 1,403 | |||
In 2006, our Company recorded impairment charges of approximately $41 million primarily related to trademarks for beverages sold in the Philippines and Indonesia. The Philippines and Indonesia are components of our Pacific operating segment. The amount of these impairment charges was determined by comparing the fair values of the intangible assets to their respective carrying values. The fair values were determined using discounted cash flow analyses. Because the fair values were less than the carrying values of the assets, we recorded impairment charges to reduce the carrying values of the assets to their respective fair values. These impairment charges were recorded in the line item other operating charges in the consolidated statement of income. Refer to Note 19.
In 2005, our Company recorded an impairment charge related to trademarks for beverages sold in the Philippines of approximately $84 million. The carrying value of our trademarks in the Philippines, prior to the recording of the impairment charges in 2005, was approximately $268 million. The impairment was the result of our revised outlook for the Philippines, which had been unfavorably impacted by declines in volume and income before income taxes resulting from the continued lack of an affordable package offering and the continued limited availability of these trademark beverages in the marketplace. We determined the amount of this impairment charge by comparing the fair value of the intangible assets to the carrying value. Fair values were derived using discounted cash flow analyses with a number of scenarios that were weighted based on the probability of different outcomes. Because the fair value was less than the carrying value of the assets, we recorded an impairment charge to reduce the carrying value of the assets to fair value. This impairment charge was recorded in the line item other operating charges in the consolidated statement of income. Refer to Note 19.
86
Table of Contents
THE COCA-COLA COMPANY AND SUBSIDIARIES
NOTES TO CONSOLIDATED FINANCIAL STATEMENTS
NOTE 7: ACCOUNTS PAYABLE AND ACCRUED EXPENSES
Accounts payable and accrued expenses consisted of the following (in millions):
| December 31, | 2007 | 2006 | ||||
| Other accrued expenses |
$ | 2,379 | $ | 1,700 | ||
| Accrued marketing |
1,749 | 1,348 | ||||
| Trade accounts payable |
1,380 | 929 | ||||
| Accrued compensation |
696 | 550 | ||||
| Sales, payroll and other taxes |
352 | 264 | ||||
| Container deposits |
359 | 264 | ||||
| Accounts payable and accrued expenses |
$ | 6,915 | $ | 5,055 | ||
NOTE 8: SHORT-TERM BORROWINGS AND CREDIT ARRANGEMENTS
Loans and notes payable consist primarily of commercial paper issued in the United States. As of December 31, 2007 and 2006, we had approximately $5,420 million and $1,942 million, respectively, outstanding in commercial paper borrowings. Our weighted-average interest rates for commercial paper outstanding were approximately 4.5 percent and 5.2 percent per year at December 31, 2007 and 2006, respectively. In addition, we had approximately $4,963 million in lines of credit and other short-term credit facilities available as of December 31, 2007, of which approximately $499 million was outstanding. The outstanding amount of approximately $499 million was primarily related to our international operations. Included in the available credit facilities discussed above, the Company had $3,750 million in lines of credit for general corporate purposes, including commercial paper backup. There were no borrowings under these lines of credit during 2007.
These credit facilities are subject to normal banking terms and conditions. Some of the financial arrangements require compensating balances, none of which is presently significant to our Company.
As of December 31, 2006, loans and notes payable included a liability to acquire the remaining approximate 59 percent of the outstanding stock of Coca-Cola Erfrischungsgetraenke AG (CCEAG). As of December 31, 2006, the Company owned approximately 41 percent of CCEAGs outstanding stock. In February 2002, the Company acquired control of CCEAG and agreed to put/call agreements with the other shareowners of CCEAG, which resulted in the recording of a liability to acquire the remaining shares in CCEAG. The present value of the total amount to be paid by our Company to all other CCEAG shareowners was approximately $1,068 million at December 31, 2006, which was paid in January 2007. This amount increased from the initial liability of approximately $600 million due to the accretion of the discounted value to the ultimate maturity of the liability and the translation adjustment related to this liability, partially offset by payments made to the other CCEAG shareowners during the term of the agreements. The accretion of the discounted value to its ultimate maturity value is recorded in the line item other income (loss)net. The accretion was approximately $58 million and $60 million, respectively, for the years ended December 31, 2006 and 2005.
87
Table of Contents
THE COCA-COLA COMPANY AND SUBSIDIARIES
NOTES TO CONSOLIDATED FINANCIAL STATEMENTS
NOTE 9: LONG-TERM DEBT
On November 1, 2007, the Company issued approximately $1,750 million of notes due on November 15, 2017. The proceeds from this $1,750 million debt issuance were used to repay short-term debt, including commercial paper issued to finance our current year acquisitions. Refer to Note 20.
Long-term debt consisted of the following (in millions):
| December 31, | 2007 | 2006 | ||||
| 5 3/4% U.S. dollar notes due 2009 |
$ | 399 | $ | 399 | ||
| 5 3/4% U.S. dollar notes due 2011 |
499 | 499 | ||||
| 5 7/20% U.S. dollar notes due 2017 |
1,747 | | ||||
| 7 3/8% U.S. dollar notes due 2093 |
116 | 116 | ||||
| Other, due through 20141 |
649 | 333 | ||||
| $ | 3,410 | $ | 1,347 | |||
| Less current portion |
133 | 33 | ||||
| Long-term debt |
$ | 3,277 | $ | 1,314 | ||
| 1 |
The weighted-average interest rate on outstanding balances was 6.5% and 6.0%, respectively, for the years ended December 31, 2007 and 2006. |
The above notes include various restrictions, none of which is presently significant to our Company.
The principal amount of our long-term debt that had fixed and variable interest rates, respectively, was approximately $3,409 million and $1 million at December 31, 2007. The principal amount of our long-term debt that had fixed and variable interest rates, respectively, was approximately $1,346 million and $1 million at December 31, 2006. The weighted-average interest rate on the outstanding balances of our Companys long-term debt was 5.8 percent and 6.0 percent, respectively, for the years ended December 31, 2007 and 2006.
Total interest paid was approximately $405 million, $212 million and $233 million in 2007, 2006 and 2005, respectively. For a more detailed discussion of interest rate management, refer to Note 12.
Maturities of long-term debt for the five years succeeding December 31, 2007 are as follows (in millions):
| Maturities of Long-Term Debt |
|||
| 2008 |
$ | 133 | |
| 2009 |
591 | ||
| 2010 |
58 | ||
| 2011 |
553 | ||
| 2012 |
196 | ||
88
Table of Contents
THE COCA-COLA COMPANY AND SUBSIDIARIES
NOTES TO CONSOLIDATED FINANCIAL STATEMENTS
NOTE 10: COMPREHENSIVE INCOME
AOCI, including our proportionate share of equity method investees AOCI, consisted of the following (in millions):
| December 31, | 2007 | 2006 | ||||||
| Foreign currency translation adjustment |
$ | 591 | $ | (984 | ) | |||
| Accumulated derivative net losses |
(113 | ) | (49 | ) | ||||
| Unrealized gain on available-for-sale securities |
161 | 147 | ||||||
| Adjustment to pension and other benefit liabilities |
(13 | ) | (405 | )1 | ||||
| Accumulated other comprehensive income (loss) |
$ | 626 | $ | (1,291 | ) | |||
| 1 |
Includes adjustment of $(288) million, net of tax, relating to the initial adoption of SFAS No. 158. Refer to Note 16. |
A summary of the components of other comprehensive income (loss), including our proportionate share of equity method investees other comprehensive income (loss), for the years ended December 31, 2007, 2006 and 2005, is as follows (in millions):
| Before-Tax Amount |
Income Tax |
After-Tax Amount |
||||||||||
| 2007 |
||||||||||||
| Net foreign currency translation adjustment |
$ | 1,729 | $ | (154 | ) | $ | 1,575 | |||||
| Net loss on derivatives |
(109 | ) | 45 | (64 | ) | |||||||
| Net change in unrealized gain on available-for-sale securities |
24 | (10 | ) | 14 | ||||||||
| Net change in pension liability |
605 | (213 | ) | 392 | ||||||||
| Other comprehensive income (loss) |
$ | 2,249 | $ | (332 | ) | $ | 1,917 | |||||
| Before-Tax Amount |
Income Tax |
After-Tax Amount |
||||||||||
| 2006 |
||||||||||||
| Net foreign currency translation adjustment |
$ | 685 | $ | (82 | ) | $ | 603 | |||||
| Net loss on derivatives |
(44 | ) | 18 | (26 | ) | |||||||
| Net change in unrealized gain on available-for-sale securities |
53 | (10 | ) | 43 | ||||||||
| Net change in pension liability, prior to adoption of SFAS No. 158 |
68 | (22 | ) | 46 | ||||||||
| Other comprehensive income (loss) |
$ | 762 | $ | (96 | ) | $ | 666 | |||||
| Before-Tax Amount |
Income Tax |
After-Tax Amount |
||||||||||
| 2005 |
||||||||||||
| Net foreign currency translation adjustment |
$ | (440 | ) | $ | 44 | $ | (396 | ) | ||||
| Net gain on derivatives |
94 | (37 | ) | 57 | ||||||||
| Net change in unrealized gain on available-for-sale securities |
20 | (7 | ) | 13 | ||||||||
| Net change in pension liability, prior to adoption of SFAS No. 158 |
5 | | 5 | |||||||||
| Other comprehensive income (loss) |
$ | (321 | ) | $ | | $ | (321 | ) | ||||
89
Table of Contents
THE COCA-COLA COMPANY AND SUBSIDIARIES
NOTES TO CONSOLIDATED FINANCIAL STATEMENTS
NOTE 11: FINANCIAL INSTRUMENTS
Certain Debt and Marketable Equity Securities
Investments in debt and marketable equity securities, other than investments accounted for by the equity method, are categorized as trading, available-for-sale or held-to-maturity. Our marketable equity investments are categorized as trading or available-for-sale with their cost basis determined by the specific identification method. Trading securities are carried at fair value with realized and unrealized gains and losses included in net income. We record available-for-sale instruments at fair value, with unrealized gains and losses, net of deferred income taxes, reported as a component of AOCI. Debt securities categorized as held-to-maturity are stated at amortized cost.
As of December 31, 2007 and 2006, trading, available-for-sale and held-to-maturity securities consisted of the following (in millions):
| Gross Unrealized |
Estimated Fair Value |
||||||||||||
| Cost | Gains | Losses | |||||||||||
| 2007 |
|||||||||||||
| Trading securities: |
|||||||||||||
| Equity securities |
$ | 90 | $ | 2 | $ | | $ | 92 | |||||
| Other securities |
12 | | (3 | ) | 9 | ||||||||
| $ | 102 | $ | 2 | $ | (3 | ) | $ | 101 | |||||
| Available-for-sale securities: |
|||||||||||||
| Equity securities |
$ | 235 | $ | 247 | $ | | $ | 482 | |||||
| Other securities |
17 | | (2 | ) | 15 | ||||||||
| $ | 252 | $ | 247 | $ | (2 | ) | $ | 497 | |||||
| Held-to-maturity securities: |
|||||||||||||
| Bank and corporate debt |
$ | 67 | $ | | $ | | $ | 67 | |||||
| Gross Unrealized |
Estimated Fair Value |
||||||||||||
| Cost | Gains | Losses | |||||||||||
| 2006 |
|||||||||||||
| Trading securities: |
|||||||||||||
| Equity securities |
$ | 60 | $ | 6 | $ | | $ | 66 | |||||
| Available-for-sale securities: |
|||||||||||||
| Equity securities |
$ | 240 | $ | 219 | $ | (1 | ) | $ | 458 | ||||
| Other securities |
13 | | | 13 | |||||||||
| $ | 253 | $ | 219 | $ | (1 | ) | $ | 471 | |||||
| Held-to-maturity securities: |
|||||||||||||
| Bank and corporate debt |
$ | 83 | $ | | $ | | $ | 83 | |||||
90
Table of Contents
THE COCA-COLA COMPANY AND SUBSIDIARIES
NOTES TO CONSOLIDATED FINANCIAL STATEMENTS
NOTE 11: FINANCIAL INSTRUMENTS (Continued)
As of December 31, 2007 and 2006, these investments were included in the following captions (in millions):
| Trading Securities |
Available- for-Sale Securities |
Held-to- Maturity Securities |
|||||||
| 2007 |
|||||||||
| Cash and cash equivalents |
$ | | $ | | $ | 66 | |||
| Current marketable securities |
101 | 113 | 1 | ||||||
| Cost method investments, principally bottling companies |
| 369 | | ||||||
| Other assets |
| 15 | | ||||||
| $ | 101 | $ | 497 | $ | 67 | ||||
| Trading Securities |
Available- for-Sale Securities |
Held-to- Maturity Securities |
|||||||
| 2006 |
|||||||||
| Cash and cash equivalents |
$ | | $ | | $ | 82 | |||
| Current marketable securities |
66 | 83 | 1 | ||||||
| Cost method investments, principally bottling companies |
| 372 | | ||||||
| Other assets |
| 16 | | ||||||
| $ | 66 | $ | 471 | $ | 83 | ||||
The contractual maturities of these investments as of December 31, 2007 were as follows (in millions):
| Trading Securities | Available-for-Sale Securities |
Held-to-Maturity Securities |
||||||||||||||||
| Cost | Fair Value |
Cost | Fair Value |
Amortized Cost |
Fair Value |
|||||||||||||
| 2008 |
$ | 2 | $ | 1 | $ | | $ | | $ | 67 | $ | 67 | ||||||
| 2009-2012 |
2 | 2 | | | | | ||||||||||||
| 2013-2017 |
5 | 3 | 2 | 2 | | | ||||||||||||
| After 2017 |
3 | 3 | 15 | 13 | | | ||||||||||||
| Equity securities |
90 | 92 | 235 | 482 | | | ||||||||||||
| $ | 102 | $ | 101 | $ | 252 | $ | 497 | $ | 67 | $ | 67 | |||||||
For the years ended December 31, 2007, 2006 and 2005, gross realized gains and losses on sales of trading and available-for-sale securities were not material. The cost of securities sold is based on the specific identification method.
Fair Value of Other Financial Instruments
The carrying amounts of cash and cash equivalents, receivables, accounts payable and accrued expenses, and loans and notes payable approximate their fair values because of the relatively short-term maturity of these instruments.
We estimate that the fair values of non-marketable cost method investments approximate their carrying amounts.
We carry our non-marketable cost method investments at cost or, if a decline in the value of the investment is deemed to be other than temporary, at fair value. Estimates of fair value are generally based upon discounted cash flow analyses.
91
Table of Contents
THE COCA-COLA COMPANY AND SUBSIDIARIES
NOTES TO CONSOLIDATED FINANCIAL STATEMENTS
NOTE 11: FINANCIAL INSTRUMENTS (Continued)
We recognize all derivative instruments as either assets or liabilities at fair value in our consolidated balance sheets, with fair values estimated based on quoted market prices or pricing models using current market rates. Virtually all of our derivatives are straightforward, over-the-counter instruments with liquid markets. For further discussion of our derivatives, including a disclosure of derivative values, refer to Note 12.
The fair value of our long-term debt is estimated based on quoted prices for those or similar instruments. As of December 31, 2007, the carrying amounts and fair values of our long-term debt, including the current portion, were approximately $3,410 million and $3,416 million, respectively. As of December 31, 2006, these carrying amounts and fair values were approximately $1,347 million and $1,386 million, respectively.
NOTE 12: HEDGING TRANSACTIONS AND DERIVATIVE FINANCIAL INSTRUMENTS
When deemed appropriate, our Company uses derivative financial instruments primarily to reduce our exposure to adverse fluctuations in interest rates and foreign currency exchange rates, commodity prices and other market risks. Derivative instruments used to manage fluctuations in certain commodity prices were not material to the consolidated financial statements for the years ended December 31, 2007, 2006 and 2005. The Company formally designates and documents the financial instrument as a hedge of a specific underlying exposure, as well as the risk management objectives and strategies for undertaking the hedge transactions. The Company formally assesses, both at the inception and at least quarterly thereafter, whether the financial instruments that are used in hedging transactions are effective at offsetting changes in either the fair value or cash flows of the related underlying exposure. Because of the high degree of effectiveness between the hedging instrument and the underlying exposure being hedged, fluctuations in the value of the derivative instruments are generally offset by changes in the fair values or cash flows of the underlying exposures being hedged. Any ineffective portion of a financial instruments change in fair value is immediately recognized in earnings. Virtually all of our derivatives are straightforward over-the-counter instruments with liquid markets. Our Company does not enter into derivative financial instruments for trading purposes.
The fair values of derivatives used to hedge or modify our risks fluctuate over time. We do not view these fair value amounts in isolation, but rather in relation to the fair values or cash flows of the underlying hedged transactions or other exposures. The notional amounts of the derivative financial instruments do not necessarily represent amounts exchanged by the parties and, therefore, are not a direct measure of our exposure to the financial risks described above. The amounts exchanged are calculated by reference to the notional amounts and by other terms of the derivatives, such as interest rates, foreign currency exchange rates or other financial indices.
Our Company recognizes all derivative instruments as either assets or liabilities in our consolidated balance sheets at fair value. The accounting for changes in fair value of a derivative instrument depends on whether it has been designated and qualifies as part of a hedging relationship and, further, on the type of hedging relationship. At the inception of the hedging relationship, the Company must designate the instrument as a fair value hedge, a cash flow hedge, or a hedge of a net investment in a foreign operation. This designation is based upon the exposure being hedged.
We have established strict counterparty credit guidelines and enter into transactions only with financial institutions of investment grade or better. We monitor counterparty exposures daily and review any downgrade in credit rating immediately. If a downgrade in the credit rating of a counterparty were to occur, we have provisions requiring collateral in the form of U.S. government securities for substantially all of our transactions. To mitigate presettlement risk, minimum credit standards become more stringent as the duration of the derivative financial instrument increases. To minimize the concentration of credit risk, we enter into derivative transactions with a portfolio of financial institutions. The Company has master netting agreements with most of the financial institutions that are counterparties
92
Table of Contents
THE COCA-COLA COMPANY AND SUBSIDIARIES
NOTES TO CONSOLIDATED FINANCIAL STATEMENTS
NOTE 12: HEDGING TRANSACTIONS AND DERIVATIVE FINANCIAL INSTRUMENTS (Continued)
to the derivative instruments. These agreements allow for the net settlement of assets and liabilities arising from different transactions with the same counterparty. Based on these factors, we consider the risk of counterparty default to be minimal.
Interest Rate Management
Our Company monitors our mix of fixed-rate and variable-rate debt as well as our mix of short-term debt versus long-term debt. This monitoring includes a review of business and other financial risks. From time to time, in anticipation of future debt issuances, we may manage our risk to interest rate fluctuations through the use of derivative financial instruments. The Company had no outstanding interest rate swaps or other related derivative financial instruments as of December 31, 2007 and 2006. Any ineffective portion, which was not significant in 2007, 2006 or 2005, of these instruments was immediately recognized in net income.
Foreign Currency Management
The purpose of our foreign currency hedging activities is to reduce the risk that our eventual U.S. dollar net cash inflows resulting from sales outside the United States will be adversely affected by changes in foreign currency exchange rates.
We enter into forward exchange contracts and purchase foreign currency options (principally euro and Japanese yen) and collars to hedge certain portions of forecasted cash flows denominated in foreign currencies. The effective portion of the changes in fair value for these contracts, which have been designated as cash flow hedges, was reported in AOCI and reclassified into earnings in the same financial statement line item and in the same period or periods during which the hedged transaction affects earnings. Any ineffective portion, which was not significant in 2007, 2006 or 2005, of the change in the fair value of these instruments was immediately recognized in net income.
Additionally, the Company enters into forward exchange contracts that are effective economic hedges and are not designated as hedging instruments under SFAS No. 133. These instruments are used to offset the earnings impact relating to the variability in foreign currency exchange rates on certain monetary assets and liabilities denominated in nonfunctional currencies. Changes in the fair value of these instruments are immediately recognized in earnings in the line item other income (loss)net in our consolidated statements of income to offset the effect of remeasurement of the monetary assets and liabilities.
The Company also enters into forward exchange contracts to hedge its net investment position in certain major currencies. Under SFAS No. 133, changes in the fair value of these instruments are recognized in foreign currency translation adjustment, a component of AOCI, to offset the change in the value of the net investment being hedged. For the years ended December 31, 2007, 2006 and 2005, we recorded net gain (loss) in foreign currency translation adjustment related to those instruments of approximately $(7) million, $3 million and $(40) million, respectively.
93
Table of Contents
THE COCA-COLA COMPANY AND SUBSIDIARIES
NOTES TO CONSOLIDATED FINANCIAL STATEMENTS
NOTE 12: HEDGING TRANSACTIONS AND DERIVATIVE FINANCIAL INSTRUMENTS (Continued)
The following table presents the carrying values, fair values and maturities of the Companys foreign currency derivative instruments outstanding as of December 31, 2007 and 2006 (in millions):
| Carrying Values Assets/(Liabilities) |
Fair Values Assets/(Liabilities) |
Maturity | ||||||||
| 2007 |
||||||||||
| Forward contracts |
$ | (58 | ) | $ | (58 | ) | 2008-2009 | |||
| Options and collars |
46 | 46 | 2008 | |||||||
| $ | (12 | ) | $ | (12 | ) | |||||
| Carrying Values Assets/(Liabilities) |
Fair Values Assets/(Liabilities) |
Maturity | ||||||||
| 2006 |
||||||||||
| Forward contracts |
$ | (21 | ) | $ | (21 | ) | 2007-2008 | |||
| Options and collars |
18 | 18 | 2007 | |||||||
| $ | (3 | ) | $ | (3 | ) | |||||
The Company estimates the fair value of its foreign currency derivatives based on quoted market prices or pricing models using current market rates. These amounts are primarily reflected in prepaid expenses and other assets and accounts payable and accrued expenses in our consolidated balance sheets. As of December 31, 2007, we had $23 million reflected in prepaid expenses and other assets and $35 million reflected in accounts payable and accrued expenses.
Summary of AOCI
For the years ended December 31, 2007, 2006 and 2005, we recorded a net gain (loss) to AOCI of approximately $(59) million, $(31) million and $55 million, respectively, net of both income taxes and reclassifications to earnings, primarily related to gains and losses on foreign currency cash flow hedges. These items will generally offset cash flow gains and losses relating to the underlying exposures being hedged in future periods. The Company estimates that it will reclassify into earnings during the next 12 months losses of approximately $46 million from the after-tax amount recorded in AOCI as of December 31, 2007, as the anticipated cash flows occur.
94
Table of Contents
THE COCA-COLA COMPANY AND SUBSIDIARIES
NOTES TO CONSOLIDATED FINANCIAL STATEMENTS
NOTE 12: HEDGING TRANSACTIONS AND DERIVATIVE FINANCIAL INSTRUMENTS (Continued)
The following table summarizes activity in AOCI related to derivatives designated as cash flow hedges held by the Company during the applicable periods (in millions):
| Before-Tax Amount |
Income Tax |
After-Tax Amount |
||||||||||
| 2007 |
||||||||||||
| Accumulated derivative net gains (losses) as of January 1, 2007 |
$ | (16 | ) | $ | 6 | $ | (10 | ) | ||||
| Net changes in fair value of derivatives |
(158 | ) | 61 | (97 | ) | |||||||
| Net reclassification from AOCI into earnings |
62 | (24 | ) | 38 | ||||||||
| Accumulated derivative net gains (losses) as of December 31, 2007 |
$ | (112 | ) | $ | 43 | $ | (69 | ) | ||||
| Before-Tax Amount |
Income Tax |
After-Tax Amount |
||||||||||
| 2006 |
||||||||||||
| Accumulated derivative net gains (losses) as of January 1, 2006 |
$ | 35 | $ | (14 | ) | $ | 21 | |||||
| Net changes in fair value of derivatives |
(38 | ) | 15 | (23 | ) | |||||||
| Net reclassification from AOCI into earnings |
(13 | ) | 5 | (8 | ) | |||||||
| Accumulated derivative net gains (losses) as of December 31, 2006 |
$ | (16 | ) | $ | 6 | $ | (10 | ) | ||||
| Before-Tax Amount |
Income Tax |
After-Tax Amount |
||||||||||
| 2005 |
||||||||||||
| Accumulated derivative net gains (losses) as of January 1, 2005 |
$ | (56 | ) | $ | 22 | $ | (34 | ) | ||||
| Net changes in fair value of derivatives |
135 | (53 | ) | 82 | ||||||||
| Net reclassification from AOCI into earnings |
(44 | ) | 17 | (27 | ) | |||||||
| Accumulated derivative net gains (losses) as of December 31, 2005 |
$ | 35 | $ | (14 | ) | $ | 21 | |||||
The Company did not discontinue any cash flow hedge relationships during the years ended December 31, 2007, 2006 and 2005.
NOTE 13: COMMITMENTS AND CONTINGENCIES
As of December 31, 2007, we were contingently liable for guarantees of indebtedness owed by third parties in the amount of approximately $267 million. These guarantees primarily are related to third-party customers, bottlers and vendors and have arisen through the normal course of business. These guarantees have various terms, and none of these guarantees was individually significant. The amount represents the maximum potential future payments that we could be required to make under the guarantees; however, we do not consider it probable that we will be required to satisfy these guarantees.
We believe our exposure to concentrations of credit risk is limited due to the diverse geographic areas covered by our operations.
The Company is involved in various legal proceedings. We establish reserves for specific legal proceedings when we determine that the likelihood of an unfavorable outcome is probable and the amount of loss can be reasonably estimated. Management has also identified certain other legal matters where we believe an unfavorable outcome is reasonably possible and/or for which no estimate of possible losses can be made. Management believes that any liability to the Company that may arise as a result of currently pending legal proceedings, including those discussed below, will not have a material adverse effect on the financial condition of the Company taken as a whole.
95
Table of Contents
THE COCA-COLA COMPANY AND SUBSIDIARIES
NOTES TO CONSOLIDATED FINANCIAL STATEMENTS
NOTE 13: COMMITMENTS AND CONTINGENCIES (Continued)
During the period from 1970 to 1981, our Company owned Aqua-Chem, Inc., now known as Cleaver-Brooks, Inc. (Aqua-Chem). A division of Aqua-Chem manufactured certain boilers that contained gaskets that Aqua-Chem purchased from outside suppliers. Several years after our Company sold this entity, Aqua-Chem received its first lawsuit relating to asbestos, a component of some of the gaskets. In September 2002, Aqua-Chem notified our Company that it believed we were obligated for certain costs and expenses associated with its asbestos litigations. Aqua-Chem demanded that our Company reimburse it for approximately $10 million for out-of-pocket litigation-related expenses. Aqua-Chem also demanded that the Company acknowledge a continuing obligation to Aqua-Chem for any future liabilities and expenses that are excluded from coverage under the applicable insurance or for which there is no insurance. Our Company disputes Aqua-Chems claims, and we believe we have no obligation to Aqua-Chem for any of its past, present or future liabilities, costs or expenses. Furthermore, we believe we have substantial legal and factual defenses to Aqua-Chems claims. The parties entered into litigation in Georgia to resolve this dispute, which was stayed by agreement of the parties pending the outcome of litigation filed in Wisconsin by certain insurers of Aqua-Chem. In that case, five plaintiff insurance companies filed a declaratory judgment action against Aqua-Chem, the Company and 16 defendant insurance companies seeking a determination of the parties rights and liabilities under policies issued by the insurers and reimbursement for amounts paid by plaintiffs in excess of their obligations. During the course of the Wisconsin coverage litigation, Aqua-Chem and the Company reached settlements with several of the insurers, including plaintiffs, who have or will pay funds into an escrow account for payment of costs arising from the asbestos claims against Aqua-Chem. On July 24, 2007, the Wisconsin trial court entered a final declaratory judgment regarding the rights and obligations of the parties under the insurance policies issued by the remaining defendant insurers, which judgment was not appealed. The judgment directs, among other things, that each insurer whose policy is triggered is jointly and severally liable for one-hundred percent of Aqua-Chems losses up to policy limits. The Georgia litigation remains subject to the stay agreement.
The Company has had discussions with the Competition Directorate of the European Commission (the European Commission) about issues relating to parallel trade within the European Union arising out of comments received by the European Commission from third parties. The Company has fully cooperated with the European Commission and has provided information on these issues and the measures taken and to be taken to address them. The Company is unable to predict at this time with any reasonable degree of certainty what action, if any, the European Commission will take with respect to these issues.
At the time we acquire or divest our interest in an entity, we sometimes agree to indemnify the seller or buyer for specific contingent liabilities. Management believes that any liability to the Company that may arise as a result of any such indemnification agreements will not have a material adverse effect on the financial condition of the Company taken as a whole.
The Company is involved in various tax matters, with respect to some of which the outcome is uncertain. We establish reserves to remove some or all of the tax benefit of any of our tax positions at the time we determine that it becomes uncertain based upon one of the following conditions: (1) the tax position is not more likely than not to be sustained, (2) the tax position is more likely than not to be sustained, but for a lesser amount, or (3) the tax position is more likely than not to be sustained, but not in the financial period in which the tax position was originally taken. For purposes of evaluating whether or not a tax position is uncertain, (1) we presume the tax position will be examined by the relevant taxing authority that has full knowledge of all relevant information, (2) the technical merits of a tax position are derived from authorities such as legislation and statutes, legislative intent, regulations, rulings and case law and their applicability to the facts and circumstances of the tax position, and (3) each tax position is evaluated without consideration of the possibility of offset or aggregation with other tax positions taken. A number of years may elapse before a particular uncertain tax position is audited and finally resolved or when a tax assessment is raised. The number
96
Table of Contents
THE COCA-COLA COMPANY AND SUBSIDIARIES
NOTES TO CONSOLIDATED FINANCIAL STATEMENTS
NOTE 13: COMMITMENTS AND CONTINGENCIES (Continued)
of years subject to tax assessments varies depending on the tax jurisdiction. The tax benefit that has been previously reserved because of a failure to meet the more likely than not recognition threshold would be recognized in our income tax expense in the first interim period when the uncertainty disappears under any one of the following conditions: (1) the tax position is more likely than not to be sustained, (2) the tax position, amount, and/or timing is ultimately settled through negotiation or litigation, or (3) the statute of limitations for the tax position has expired. Refer to Note 17.
NOTE 14: NET CHANGE IN OPERATING ASSETS AND LIABILITIES
Net cash provided by (used in) operating activities attributable to the net change in operating assets and liabilities is composed of the following (in millions):
| Year Ended December 31, | 2007 | 2006 | 2005 | |||||||||
| (Increase) in trade accounts receivable |
$ | (406 | ) | $ | (214 | ) | $ | (79 | ) | |||
| (Increase) in inventories |
(258 | ) | (150 | ) | (79 | ) | ||||||
| (Increase) decrease in prepaid expenses and other assets |
(244 | ) | (152 | ) | 244 | |||||||
| Increase in accounts payable and accrued expenses |
762 | 173 | 280 | |||||||||
| Increase (decrease) in accrued taxes |
185 | (68 | ) | 145 | ||||||||
| (Decrease) in other liabilities |
(33 | ) | (204 | ) | (81 | ) | ||||||
| $ | 6 | $ | (615 | ) | $ | 430 | ||||||
NOTE 15: STOCK COMPENSATION PLANS
Effective January 1, 2006, the Company adopted SFAS No. 123(R) using the modified prospective method. Based on the terms of our plans, our Company did not have a cumulative effect related to its plans. The adoption of SFAS No. 123(R) did not have a material impact on our stock-based compensation expense for the year ended December 31, 2006. Prior to 2006, our Company accounted for stock option plans and restricted stock plans under the preferable fair value recognition provisions of SFAS No. 123.
Our total stock-based compensation expense was approximately $313 million, $324 million and $324 million in 2007, 2006 and 2005, respectively. These amounts were recorded in selling, general and administrative expenses in our consolidated statements of income. The total income tax benefit recognized in the income statement for share-based compensation arrangements was approximately $91 million, $93 million and $90 million for 2007, 2006 and 2005, respectively. As of December 31, 2007, we had approximately $441 million of total unrecognized compensation cost related to nonvested share-based compensation arrangements granted under our plans. This cost is expected to be recognized over a weighted-average period of 1.8 years as stock-based compensation expense. This expected cost does not include the impact of any future stock-based compensation awards. Additionally, our equity method investees also adopted SFAS No. 123(R) effective January 1, 2006. Our proportionate share of the stock-based compensation expense resulting from the adoption of SFAS No. 123(R) by our equity method investees is recognized as a reduction to equity income. The adoption of SFAS No. 123(R) by our equity method investees did not have a material impact on our consolidated financial statements.
During 2005, the Company changed its estimated service period for retirement-eligible participants in its plans when the terms of their stock-based compensation awards provide for accelerated vesting upon early retirement. The full-year impact of this change in our estimated service period was approximately $50 million for 2005.
97
Table of Contents
THE COCA-COLA COMPANY AND SUBSIDIARIES
NOTES TO CONSOLIDATED FINANCIAL STATEMENTS
NOTE 15: STOCK COMPENSATION PLANS (Continued)
Stock Option Plans
Under our 1991 Stock Option Plan (the 1991 Option Plan), a maximum of 120 million shares of our common stock was approved to be issued or transferred to certain officers and employees pursuant to stock options granted under the 1991 Option Plan. Options to purchase common stock under the 1991 Option Plan have been granted to Company employees at fair market value at the date of grant.
The 1999 Stock Option Plan (the 1999 Option Plan) was approved by shareowners in April 1999. Following the approval of the 1999 Option Plan, no grants were made from the 1991 Option Plan, and shares available under the 1991 Option Plan were no longer available to be granted. Under the 1999 Option Plan, a maximum of 120 million shares of our common stock was approved to be issued or transferred to certain officers and employees pursuant to stock options granted under the 1999 Option Plan. Options to purchase common stock under the 1999 Option Plan have been granted to Company employees at fair market value at the date of grant.
The 2002 Stock Option Plan (the 2002 Option Plan) was approved by shareowners in April 2002. An amendment to the 2002 Option Plan which permitted the issuance of stock appreciation rights was approved by shareowners in April 2003. Under the 2002 Option Plan, a maximum of 120 million shares of our common stock was approved to be issued or transferred to certain officers and employees pursuant to stock options and stock appreciation rights granted under the 2002 Option Plan. The stock appreciation rights permit the holder, upon surrendering all or part of the related stock option, to receive common stock in an amount up to 100 percent of the difference between the market price and the option price. No stock appreciation rights have been issued under the 2002 Option Plan as of December 31, 2007. Options to purchase common stock under the 2002 Option Plan have been granted to Company employees at fair market value at the date of grant.
Stock options granted in December 2003 and thereafter generally become exercisable over four years (with approximately 25 percent of the total grant vesting each year on the anniversary of the grant date) and expire 10 years from the date of grant. Stock options granted from 1999 through July 2003 generally became exercisable over four-years and expire 15 years from the date of grant. Prior to 1999, stock options generally became exercisable over a three-year vesting period and expire 10 years from the date of grant. The 1999 Stock Option Plan and the 2002 Stock Option Plan have been amended to provide a maximum option term of 10 years for all new grants.
The fair value of each option award is estimated on the grant date using a Black-Scholes-Merton option-pricing model that uses the assumptions noted in the following table. The expected term of the options represents the period of time that options granted are expected to be outstanding and is derived by analyzing historic exercise behavior. Expected volatilities are based on implied volatilities from traded options on the Companys stock, historical volatility of the Companys stock, and other factors. The risk-free interest rate for the period matching the expected term of the option is based on the U.S. Treasury yield curve in effect at the time of the grant. The dividend yield is the calculated yield on the Companys stock at the time of the grant.
The common stock to be issued, transferred and/or sold under the stock option plans shall be made available from authorized and unissued Company common stock or from the Companys treasury shares. In 2007, the Company began issuing common stock under these plans from the Companys treasury shares.
98
Table of Contents
THE COCA-COLA COMPANY AND SUBSIDIARIES
NOTES TO CONSOLIDATED FINANCIAL STATEMENTS
NOTE 15: STOCK COMPENSATION PLANS (Continued)
The following table sets forth information about the weighted-average fair value of options granted during the past three years and the weighted-average assumptions used for such grants:
| 2007 | 2006 | 2005 | |||||||
| Fair value of options at grant date |
$ 8.46 | $ 8.16 | $ 8.23 | ||||||
| Dividend yields |
2.6 | % | 2.7 | % | 2.6 | % | |||
| Expected volatility |
15.4 | % | 19.3 | % | 19.9 | % | |||
| Risk-free interest rates |
4.6 | % | 4.5 | % | 4.3 | % | |||
| Expected term of the option |
6 years | 6 years | 6 years |
99
Table of Contents
THE COCA-COLA COMPANY AND SUBSIDIARIES
NOTES TO CONSOLIDATED FINANCIAL STATEMENTS
NOTE 15: STOCK COMPENSATION PLANS (Continued)
A summary of stock option activity under all plans for the years ended December 31, 2007, 2006 and 2005 is as follows:
| Shares (In millions) |
Weighted-Average Exercise Price |
Weighted-Average Remaining Contractual Life |
Aggregate Intrinsic Value (In millions) |
||||||||
| 2007 |
|||||||||||
| Outstanding on January 1, 2007 |
186 | $ | 48.52 | ||||||||
| Granted1 |
41 | 48.06 | |||||||||
| Exercised |
(31 | ) | 46.79 | ||||||||
| Forfeited/expired2 |
(14 | ) | 53.91 | ||||||||
| Outstanding on December 31, 2007 |
182 | $ | 48.29 | 7.6 years | $ | 2,419 | |||||
| Expected to vest at December 31, 2007 |
178 | $ | 48.35 | 7.6 years | $ | 2,357 | |||||
| Exercisable on December 31, 2007 |
121 | $ | 49.66 | 7.2 years | $ | 1,453 | |||||
| Shares available on December 31, 2007 for options that may be granted |
30 | ||||||||||
| Shares (In millions) |
Weighted-Average Exercise Price |
Weighted-Average Remaining Contractual Term |
Aggregate Intrinsic Value (In millions) |
||||||||
| 2006 |
|||||||||||
| Outstanding on January 1, 2006 |
203 | $ | 48.50 | ||||||||
| Granted1 |
2 | 41.65 | |||||||||
| Exercised |
(4 | ) | 44.53 | ||||||||
| Forfeited/expired2 |
(15 | ) | 48.30 | ||||||||
| Outstanding on December 31, 2006 |
186 | $ | 48.52 | 8.1 years | $ | 502 | |||||
| Exercisable on December 31, 2006 |
141 | $ | 50.50 | 8.0 years | $ | 227 | |||||
| Shares available on December 31, 2006 for options that may be granted |
64 | ||||||||||
| Shares (In millions) |
Weighted-Average Exercise Price |
Weighted-Average Remaining Contractual Term |
Aggregate Intrinsic Value (In millions) |
||||||||
| 2005 |
|||||||||||
| Outstanding on January 1, 2005 |
183 | $ | 49.41 | ||||||||
| Granted1 |
34 | 41.26 | |||||||||
| Exercised |
(7 | ) | 35.63 | ||||||||
| Forfeited/expired2 |
(7 | ) | 49.11 | ||||||||
| Outstanding on December 31, 2005 |
203 | $ | 48.50 | 8.8 years | $ | 0 | |||||
| Exercisable on December 31, 2005 |
131 | $ | 51.61 | 8.4 years | $ | 0 | |||||
| Shares available on December 31, 2005 for options that may be granted |
58 | ||||||||||
| 1 |
No grants were made from the 1991 Option Plan during 2007, 2006 or 2005. |
| 2 |
Shares forfeited/expired relate to the 1991, 1999 and 2002 Option Plans. |
The total intrinsic value of the options exercised during the years ended December 31, 2007, 2006 and 2005 was $284 million, $11 million and $49 million, respectively.
100
Table of Contents
THE COCA-COLA COMPANY AND SUBSIDIARIES
NOTES TO CONSOLIDATED FINANCIAL STATEMENTS
NOTE 15: STOCK COMPENSATION PLANS (Continued)
Restricted Stock Award Plans
Under the amended 1989 Restricted Stock Award Plan and the amended 1983 Restricted Stock Award Plan (the Restricted Stock Award Plans), 40 million and 24 million shares of restricted common stock, respectively, were originally available to be granted to certain officers and key employees of our Company.
At December 31, 2007, approximately 28 million shares remain available for grant under the Restricted Stock Award Plans, when all outstanding awards including promises to grant restricted stock and performance share unit (PSU) awards at the target level are included. Participants are entitled to vote and receive dividends on the restricted shares and, for awards prior to January 1, 2008 under the 1983 Restricted Stock Award Plan, participants are reimbursed by our Company for income taxes imposed on the award, but not for taxes generated by the reimbursement payment. The 1983 Restricted Stock Plan has been amended to eliminate this tax reimbursement for future awards. The shares are subject to certain transfer restrictions and may be forfeited if a participant leaves our Company for reasons other than retirement, disability or death, absent a change in control of our Company.
The following awards were outstanding and nonvested as of December 31, 2007:
| | 479,459 shares of time-based restricted stock and promises to grant restricted stock in which the restrictions lapse upon the achievement of continued employment over a specified period of time; |
| | 286,800 shares of performance-based restricted stock and promises to grant restricted stock in which restrictions lapse upon the achievement of specific performance goals over a specified performance period; |
| | 2,780,333 PSU awards which could result in a future grant of restricted stock after the achievement of specific performance goals over a specified performance period. Such awards are subject to adjustment based on the final performance relative to the goals, resulting in a minimum grant of no shares and a maximum grant of 4,545,750 shares; and |
| | 422,238 shares of restricted stock and promises to grant restricted stock were issued for PSU awards. |
The Company recognizes compensation expense for awards that are subject to performance criteria, when it is probable that the performance criteria specified in the plan will be achieved. The compensation expense is recognized on a straight-line basis over the remaining vesting period and is recorded in selling, general and administrative expenses.
101
Table of Contents
THE COCA-COLA COMPANY AND SUBSIDIARIES
NOTES TO CONSOLIDATED FINANCIAL STATEMENTS
NOTE 15: STOCK COMPENSATION PLANS (Continued)
Time-Based Restricted Stock Awards
The following table summarizes information about time-based restricted stock awards:
| 2007 | 2006 | 2005 | ||||||||||||||||
| Shares | Weighted- Average Grant-Date Fair Value |
Shares | Weighted- Average Grant-Date Fair Value |
Shares | Weighted- Average Grant-Date Fair Value |
|||||||||||||
| Nonvested on January 1 |
413,700 | $ | 35.84 | 432,700 | $ | 36.46 | 513,700 | $ | 39.97 | |||||||||
| Granted |
55,180 | 56.34 | | | 9,000 | 41.80 | ||||||||||||
| Promises to grant |
20,579 | 53.35 | 21,000 | 48.84 | 10,000 | 42.84 | ||||||||||||
| Vested and released1 |
| | (30,000 | ) | 58.48 | (100,000 | ) | 55.62 | ||||||||||
| Cancelled/forfeited |
(10,000 | ) | 42.84 | (10,000 | ) | 21.91 | | | ||||||||||
| Nonvested on December 31 |
479,459 | 2 | $ | 38.81 | 413,700 | 2 | $ | 35.84 | 432,700 | 2 | $ | 36.46 | ||||||
| 1 |
The total fair value of time-based restricted shares vested and released during the years ended December 31, 2006 and 2005, was approximately $1.3 million and $4.3 million, respectively. The grant-date fair value is the quoted market value of the Company stock on the respective grant date. |
| 2 |
The nonvested shares on December 31, 2007, 2006 and 2005 include promises to grant time-based restricted stock of 41,579; 31,000; and 10,000, respectively. These awards are similar to time-based restricted stock, including the payment of dividend equivalents, but were granted in this manner because the employees were based outside of the United States. |
Performance-Based Restricted Stock Awards
In 2001, shareowners approved an amendment to the 1989 Restricted Stock Award Plan to allow for the grant of performance-based awards. These awards are released only upon the achievement of specific measurable performance criteria. These awards pay dividends during the performance period. The majority of awards have specific earnings per share targets for achievement. If the earnings per share targets are not met, the awards will be cancelled.
102
Table of Contents
THE COCA-COLA COMPANY AND SUBSIDIARIES
NOTES TO CONSOLIDATED FINANCIAL STATEMENTS
NOTE 15: STOCK COMPENSATION PLANS (Continued)
The following table summarizes information about performance-based restricted stock awards:
| 2007 | 2006 | 2005 | ||||||||||||||||
| Shares | Weighted- Average Grant-Date Fair Value |
Shares | Weighted- Average Grant-Date Fair Value |
Shares | Weighted- Average Grant-Date Fair Value |
|||||||||||||
| Nonvested on January 1 |
293,000 | $ | 43.40 | 788,000 | $ | 47.32 | 838,000 | $ | 47.62 | |||||||||
| Granted |
28,100 | 53.43 | 224,000 | 43.66 | 50,000 | 42.40 | ||||||||||||
| Promises to grant |
15,700 | 63.77 | | | | | ||||||||||||
| Vested and released1 |
| | (50,000 | ) | 56.25 | | | |||||||||||
| Cancelled/forfeited |
(50,000 | ) | 42.40 | (669,000 | ) | 47.15 | (100,000 | ) | 47.38 | |||||||||
| Nonvested on December 31 |
286,800 | 2 | $ | 45.67 | 293,000 | $ | 43.40 | 788,000 | 2 | $ | 47.32 | |||||||
| 1 |
The total fair value of performance-based restricted shares vested and released during the year ended December 31, 2006, was approximately $2.1 million. The grant-date fair value is the quoted market value of the Company stock on the respective grant date. |
| 2 |
The nonvested shares on December 31, 2007 and 2005 include promises to grant performance-based restricted stock of 15,700 and 75,000, respectively. These awards are similar to performance-based restricted stock, including the payment of dividend equivalents, but were granted in this manner because the employees were based outside of the United States. |
Performance Share Unit Awards
In 2003, the Company modified its use of performance-based awards and established a program to grant performance share unit awards under the 1989 Restricted Stock Award Plan to executives. The number of performance share units earned shall be determined at the end of each performance period, generally three years, based on performance criteria determined by the Board of Directors and may result in an award of restricted stock for U.S. participants and certain international participants at that time. The restricted stock may be granted to other international participants shortly before the fifth anniversary of the original award. Restrictions on such stock generally lapse on the fifth anniversary of the original award date. Performance share units do not pay dividends during the performance period. Accordingly, the fair value of these units is the quoted market value of the Company stock on the date of the grant less the present value of the expected dividends not received during the performance period.
Performance share unit awards require achievement of certain financial measures primarily compound annual growth in earnings per share or economic profit. These financial measures are adjusted for certain items approved by the Compensation Committee of the Board of Directors. The purpose of these adjustments is to ensure a consistent year to year comparison of the specific performance criteria. Economic profit is our net operating profit after tax less the cost of the capital used in our business. In the event that the financial result equals the target projection, the Company will grant the number of restricted shares equal to the Target Award in the underlying PSU agreement. In the event the financial result exceeds the target projection, additional shares up to the Maximum Award may be granted. In the event the financial result falls below the target projection, a reduced number of shares may be granted. If the financial result falls below the Threshold Award performance level, no shares will be granted. Performance share unit awards provide for cash equivalent payments to former executives who become ineligible for restricted stock grants due to certain events such as death, disability or termination. Of the outstanding granted performance share unit awards as of December 31, 2007, 743,494; 754,700; and 1,045,639 awards are for the 2005-2007, 2006-2008 and 2007-2009 performance periods, respectively. Based on the Companys financial results for the 2005-2007 performance period,
103
Table of Contents
THE COCA-COLA COMPANY AND SUBSIDIARIES
NOTES TO CONSOLIDATED FINANCIAL STATEMENTS
NOTE 15: STOCK COMPENSATION PLANS (Continued)
the Maximum Award of 150 percent of target was achieved. Also, outstanding as of December 31, 2007 are 164,500 performance share units granted in 2007 with certain financial measures of a business unit of the Company as the performance criteria. In addition, 72,000 performance share units, with predefined qualitative performance criteria and release criteria that differ from the program described above, were granted in 2004 and were outstanding as of December 31, 2007.
The following table summarizes information about performance share unit awards based on the Target Award amounts in the PSU agreements:
| 2007 | 2006 | 2005 | ||||||||||||||||
| Share Units | Weighted- Average Grant-Date Fair Value |
Share Units | Weighted- Average Grant-Date Fair Value |
Share Units | Weighted- Average Grant-Date Fair Value |
|||||||||||||
| Outstanding on January 1 |
2,271,240 | $ | 39.99 | 2,356,728 | $ | 40.42 | 1,583,447 | $ | 41.83 | |||||||||
| Granted |
1,221,578 | 46.51 | 160,000 | 37.84 | 835,440 | 37.71 | ||||||||||||
| Conversions: |
||||||||||||||||||
| Restricted stock1 |
(203,609 | ) | 45.45 | (123,852 | ) | 42.07 | | | ||||||||||
| Promises to grant2 |
(179,292 | ) | 46.78 | | | | | |||||||||||
| Paid in cash equivalent3 |
(23,790 | ) | 46.83 | (7,178 | ) | 41.87 | | | ||||||||||
| Cancelled/forfeited |
(305,794 | ) | 44.22 | (114,458 | ) | 43.45 | (62,159 | ) | 40.06 | |||||||||
| Outstanding on December 31 |
2,780,333 | $ | 41.50 | 2,271,240 | $ | 39.99 | 2,356,728 | $ | 40.42 | |||||||||
| 1 |
Represents performance share units converted to restricted stock based on the certification of financial results for the 2004-2006 performance period and for certain executives prior to retirement. The vesting of this restricted stock is subject to terms of the performance share unit agreements. |
| 2 |
Represents performance share units converted to promises to grant restricted stock for executives based on the certification of financial results for the 2004-2006 performance period. These awards are similar to restricted stock, including payment of dividend equivalents, but were granted in this manner because the executives were based outside of the United States. The vesting of promises to grant restricted stock is subject to terms of the performance share unit agreements. |
| 3 |
Represents share units that converted to cash equivalent payments of approximately $1.2 million and $0.3 million in 2007 and 2006, respectively, to former executives who were ineligible for restricted stock grants due to certain events such as death, disability or termination. |
The following table summarizes the number of performance share units at various award levels:
| December 31, | 2007 | 2006 | 2005 | |||
| Threshold Award |
1,627,376 | 1,297,632 | 1,352,388 | |||
| Target Award |
2,780,333 | 2,271,240 | 2,356,728 | |||
| Maximum Award |
4,545,750 | 3,370,860 | 3,499,092 |
104
Table of Contents
THE COCA-COLA COMPANY AND SUBSIDIARIES
NOTES TO CONSOLIDATED FINANCIAL STATEMENTS
NOTE 15: STOCK COMPENSATION PLANS (Continued)
The following table summarizes information about the conversions of performance share unit awards to restricted stock and promises to grant restricted stock:
| 2007 | 2006 | ||||||||||
| Share Units | Weighted- Average Grant-Date Fair Value1 |
Share Units | Weighted- Average Grant-Date Fair Value1 |
||||||||
| Nonvested on January 1 |
123,852 | $ | 42.07 | | $ | | |||||
| Granted |
203,609 | 45.45 | 123,852 | 42.07 | |||||||
| Promises to grant |
179,292 | 46.78 | | | |||||||
| Vested and released2 |
(59,515 | ) | 46.78 | | | ||||||
| Cancelled/forfeited |
(25,000 | ) | 46.78 | | | ||||||
| Nonvested on December 31 |
422,238 | 3 | $ | 44.76 | 123,852 | $ | 42.07 | ||||
| 1 |
The weighted-average grant-date fair value is based on the fair values of the PSU awards-grant fair values. |
| 2 |
The total fair value of restricted shares that were vested and released during the year ended December 31, 2007 was approximately $2.9 million. |
| 3 |
The nonvested shares on December 31, 2007 include promises to grant restricted stock of 179,292. These awards are similar to restricted stock, including the payment of dividend equivalents, but were granted in this manner because the employees were based outside of the United States. |
NOTE 16: PENSION AND OTHER POSTRETIREMENT BENEFIT PLANS
Our Company sponsors and/or contributes to pension and postretirement health care and life insurance benefit plans covering substantially all U.S. employees. We also sponsor nonqualified, unfunded defined benefit pension plans for certain associates. In addition, our Company and its subsidiaries have various pension plans and other forms of postretirement arrangements outside the United States.
Effective December 31, 2006, the Company adopted SFAS No. 158, which required the recognition in pension obligations and AOCI of actuarial gains or losses, prior service costs or credits and transition assets or obligations that had previously been deferred under the reporting requirements of SFAS No. 87, SFAS No. 106 and SFAS No. 132(R). As a result of the adoption, the Company recorded approximately $288 million as a reduction of the December 31, 2006 retained earnings. The applicable December 31, 2007 and 2006 balances included in our consolidated financial statements and footnotes reflect the adoption of SFAS No. 158.
In February and October of 2007, the Company amended its U.S. retiree medical plan to limit the Companys exposure to increases in retiree medical costs associated with current and future retirees. Based on the materiality of the change in liability resulting from the amendments, we remeasured the assets and liabilities of the U.S. retiree medical plan effective February 28, 2007 and October 31, 2007. As a result of the remeasurements, the Company reduced its liabilities for the U.S. retiree medical plan by approximately $435 million. In accordance with SFAS No. 158, the Company also recognized the appropriate effects of the change in AOCI and deferred taxes.
Certain amounts in the prior years disclosure have been reclassified to conform to the current year presentation.
105
Table of Contents
THE COCA-COLA COMPANY AND SUBSIDIARIES
NOTES TO CONSOLIDATED FINANCIAL STATEMENTS
NOTE 16: PENSION AND OTHER POSTRETIREMENT BENEFIT PLANS (Continued)
Obligations and Funded Status
The following table sets forth the change in benefit obligations for our benefit plans (in millions):
| Pension Benefits | Other Benefits | |||||||||||||||
| December 31, | 2007 | 2006 | 2007 | 2006 | ||||||||||||
| Benefit obligation at beginning of year1 |
$ 3,297 | $ | 3,041 | $ | 828 | $ | 787 | |||||||||
| Service cost |
123 | 108 | 40 | 31 | ||||||||||||
| Interest cost |
191 | 168 | 34 | 46 | ||||||||||||
| Foreign currency exchange rate changes |
117 | 79 | 1 | (1 | ) | |||||||||||
| Amendments |
48 | 4 | (342 | ) | | |||||||||||
| Actuarial (gain) loss |
(189 | ) | (55 | ) | (95 | ) | (25 | ) | ||||||||
| Benefits paid2 |
(159 | ) | (137 | ) | (31 | ) | (23 | ) | ||||||||
| Business combinations |
103 | 96 | | 10 | ||||||||||||
| Settlements |
(23 | ) | (10 | ) | | | ||||||||||
| Curtailments |
1 | | | | ||||||||||||
| Special termination benefits |
7 | | | | ||||||||||||
| Other |
1 | 3 | 3 | 3 | ||||||||||||
| Benefit obligation at end of year1 |
$ | 3,517 | $ | 3,297 | $ | 438 | $ | 828 | ||||||||
| 1 |
For pension benefit plans, the benefit obligation is the projected benefit obligation. For other benefit plans, the benefit obligation is the accumulated postretirement benefit obligation. |
| 2 |
Benefits paid from pension benefit plans during 2007 and 2006 included approximately $41 million and $31 million, respectively, in payments related to unfunded pension plans that were paid from Company assets. Benefits paid from other benefit plans during 2007 and 2006 included approximately $13 million and $23 million, respectively, that were paid from Company assets. |
The accumulated benefit obligation for our pension plans was approximately $3,080 million and approximately $2,885 million as of December 31, 2007 and 2006, respectively.
For pension plans with projected benefit obligations in excess of plan assets, the total projected benefit obligation and fair value of plan assets were approximately $1,372 million and $691 million, respectively, as of December 31, 2007, and $1,591 million and $890 million, respectively, as of December 31, 2006. For pension plans with accumulated benefit obligations in excess of plan assets, the total accumulated benefit obligation and fair value of plan assets were approximately $996 million and $441 million, respectively, as of December 31, 2007, and approximately $852 million and $278 million, respectively, as of December 31, 2006.
106
Table of Contents
THE COCA-COLA COMPANY AND SUBSIDIARIES
NOTES TO CONSOLIDATED FINANCIAL STATEMENTS
NOTE 16: PENSION AND OTHER POSTRETIREMENT BENEFIT PLANS (Continued)
The following table sets forth the change in the fair value of plan assets for our benefit plans (in millions):
| Pension Benefits | Other Benefits | ||||||||||||||
| December 31, | 2007 | 2006 | 2007 | 2006 | |||||||||||
| Fair value of plan assets at beginning of year1 |
$ | 3,091 | $ | 2,637 | $ | 248 | $ | 19 | |||||||
| Actual return on plan assets |
269 | 339 | 13 | 5 | |||||||||||
| Employer contributions |
59 | 95 | | 224 | |||||||||||
| Foreign currency exchange rate changes |
98 | 62 | | | |||||||||||
| Benefits paid |
(118 | ) | (106 | ) | (18 | ) | | ||||||||
| Business combinations |
35 | 68 | | | |||||||||||
| Settlements |
(1 | ) | | | | ||||||||||
| Other |
(5 | ) | (4 | ) | 3 | | |||||||||
| Fair value of plan assets at end of year1 |
$ | 3,428 | $ | 3,091 | $ | 246 | $ | 248 | |||||||
| 1 |
Plan assets include 1.6 million shares of common stock of our Company with a fair value of approximately $99 million and $77 million as of December 31, 2007 and 2006, respectively. Dividends received on common stock of our Company during 2007 and 2006 were approximately $2.2 million and $2.0 million, respectively. |
The pension and other benefit amounts recognized in our consolidated balance sheets are as follows (in millions):
| Pension Benefits | Other Benefits | |||||||||||||||
| December 31, | 2007 | 2006 | 2007 | 2006 | ||||||||||||
| Funded statusplan assets less than benefit obligations |
$ | (89 | ) | $ | (206 | ) | $ | (192 | ) | $ | (580 | ) | ||||
| Fourth quarter contribution |
4 | 3 | | | ||||||||||||
| Net prepaid asset (liability) recognized |
$ | (85 | ) | $ | (203 | ) | $ | (192 | ) | $ | (580 | ) | ||||
| Prepaid benefit cost |
$ | 596 | $ | 494 | $ | | $ | | ||||||||
| Current liability |
(42 | ) | (31 | ) | (1 | ) | | |||||||||
| Long-term liability |
(639 | ) | (666 | ) | (191 | ) | (580 | ) | ||||||||
| Net prepaid asset (liability) recognized |
$ | (85 | ) | $ | (203 | ) | $ | (192 | ) | $ | (580 | ) | ||||
107
Table of Contents
THE COCA-COLA COMPANY AND SUBSIDIARIES
NOTES TO CONSOLIDATED FINANCIAL STATEMENTS
NOTE 16: PENSION AND OTHER POSTRETIREMENT BENEFIT PLANS (Continued)
The following tables set forth the 2007 changes in AOCI for our benefit plans (in millions):
| Pension Benefits | Other Benefits | |||||||
| Net actuarial loss (gain) at beginning of year |
$ | 265 | $ | 97 | ||||
| Amortization of (loss) gain |
(18 | ) | (1 | ) | ||||
| (Gain) loss arising during the year |
(227 | ) | (88 | ) | ||||
| Translation loss (gain) |
9 | | ||||||
| Net actuarial loss (gain) at end of year |
$ | 29 | $ | 8 | ||||
| Pension Benefits | Other Benefits | |||||||
| Net prior service cost (credit) at beginning of year |
$ | 37 | $ | (5 | ) | |||
| Amortization of (cost) credit |
(7 | ) | 42 | |||||
| Cost (credit) arising during the year |
48 | (342 | ) | |||||
| Translation loss (gain) |
1 | | ||||||
| Net prior service cost (credit) at end of year |
$ | 79 | $ | (305 | ) | |||
Amounts in AOCI expected to be recognized as components of net periodic pension cost in 2008 are as follows (in millions, pretax):
| Pension Benefits | Other Benefits | ||||||
| Amortization of actuarial loss (gain) |
$ | 9 | $ | | |||
| Amortization of prior service cost (credit) |
10 | (61 | ) | ||||
| $ | 19 | $ | (61 | ) | |||
Components of Net Periodic Benefit Cost
Net periodic benefit cost for our pension and other postretirement benefit plans consisted of the following (in millions):
| Pension Benefits | Other Benefits | |||||||||||||||||||||||
| December 31, | 2007 | 2006 | 2005 | 2007 | 2006 | 2005 | ||||||||||||||||||
| Service cost |
$ | 123 | $ | 108 | $ | 91 | $ | 40 | $ | 31 | $ | 28 | ||||||||||||
| Interest cost |
191 | 168 | 156 | 34 | 46 | 43 | ||||||||||||||||||
| Expected return on plan assets |
(231 | ) | (191 | ) | (167 | ) | (20 | ) | (5 | ) | (1 | ) | ||||||||||||
| Amortization of prior service cost (credit) |
7 | 7 | 7 | (42 | ) | | | |||||||||||||||||
| Amortization of actuarial loss (gain) |
18 | 46 | 37 | 1 | 3 | 1 | ||||||||||||||||||
| Net periodic benefit cost |
$ | 108 | $ | 138 | $ | 124 | $ | 13 | $ | 75 | $ | 71 | ||||||||||||
| Settlement charge |
3 | 1 | 6 | | | | ||||||||||||||||||
| Curtailment charge |
2 | | | | | | ||||||||||||||||||
| Total costs recognized in the statements of income |
$ | 113 | $ | 139 | $ | 130 | $ | 13 | $ | 75 | $ | 71 | ||||||||||||
108
Table of Contents
THE COCA-COLA COMPANY AND SUBSIDIARIES
NOTES TO CONSOLIDATED FINANCIAL STATEMENTS
NOTE 16: PENSION AND OTHER POSTRETIREMENT BENEFIT PLANS (Continued)
Assumptions
Certain weighted-average assumptions used in computing the benefit obligations are as follows:
| Pension Benefits | Other Benefits | |||||||||||
| December 31, | 2007 | 2006 | 2007 | 2006 | ||||||||
| Discount rate |
6 | % | 5 1/2 | % | 6 1/4 | % | 6 | % | ||||
| Rate of increase in compensation levels |
4 1/4 | % | 4 1/4 | % | N/A | N/A | ||||||
Certain weighted-average assumptions used in computing net periodic benefit cost are as follows:
| Pension Benefits | Other Benefits | |||||||||||||||||
| Year Ended December 31, | 2007 | 2006 | 2005 | 2007 | 2006 | 2005 | ||||||||||||
| Discount rate |
5 1/2 | % | 5 1/4 | % | 5 1/2 | % | 6 | % | 5 3/4 | % | 6 | % | ||||||
| Rate of increase in compensation levels |
4 1/4 | % | 4 | % | 4 | % | N/A | N/A | N/A | |||||||||
| Expected long-term rate of return on plan assets |
7 3/4 | % | 7 3/4 | % | 7 3/4 | % | 8 1/2 | % | 8 1/2 | % | 8 1/2 | % | ||||||
The assumed health care cost trend rates are as follows:
| December 31, | 2007 | 2006 | ||||
| Health care cost trend rate assumed for next year |
9 | % | 9 | % | ||
| Rate to which the cost trend rate is assumed to decline (the ultimate trend rate) |
5 | % | 5 | % | ||
| Year that the rate reaches the ultimate trend rate |
2012 | 2011 |
During 2007, the Company amended its U.S. retiree medical plan to limit the Companys exposure to increases in retiree medical costs for both current and future retirees. As a result, the effects of a one percentage point change in the assumed health care cost trend rate would not be significant to the Company.
The discount rate assumptions used to account for pension and other postretirement benefit plans reflect the rates at which the benefit obligations could be effectively settled. Rates for each of our primary U.S. plans at December 31, 2007 were determined using a cash flow matching technique whereby the rates of a yield curve, developed from high- quality debt securities, were applied to the benefit obligations to determine the appropriate discount rate. The rate of compensation increase assumption is determined by the Company based upon annual reviews. We review external data and our own historical trends for health care costs to determine the health care cost trend rate assumptions.
109
Table of Contents
THE COCA-COLA COMPANY AND SUBSIDIARIES
NOTES TO CONSOLIDATED FINANCIAL STATEMENTS
NOTE 16: PENSION AND OTHER POSTRETIREMENT BENEFIT PLANS (Continued)
Plan Assets
Pension Benefit Plans
The following table sets forth the actual asset allocation and weighted-average target asset allocation for our U.S. and non-U.S. pension plan assets:
| December 31, | 2007 | 2006 | Target Asset Allocation |
||||||
| Equity securities1 |
58 | % | 58 | % | 56 | % | |||
| Debt securities |
29 | 31 | 34 | ||||||
| Real estate and other2 |
13 | 11 | 10 | ||||||
| Total |
100 | % | 100 | % | 100 | % |
| 1 |
As of December 31, 2007 and 2006, 3 percent and 2 percent, respectively, of total pension plan assets were invested in common stock of our Company. |
| 2 |
As of December 31, 2007 and 2006, 7 percent and 6 percent, respectively, of total pension plan assets were invested in real estate. |
Investment objectives for the Companys U.S. pension plan assets, which comprise 66 percent of total pension plan assets as of December 31, 2007, are to:
| (1) | optimize the long-term return on plan assets at an acceptable level of risk; |
| (2) | maintain a broad diversification across asset classes and among investment managers; |
| (3) | maintain careful control of the risk level within each asset class; and |
| (4) | focus on a long-term return objective. |
Asset allocation targets promote optimal expected return and volatility characteristics given the long-term time horizon for fulfilling the obligations of the pension plans. Selection of the targeted asset allocation for U.S. plan assets was based upon a review of the expected return and risk characteristics of each asset class, as well as the correlation of returns among asset classes.
Investment guidelines are established with each investment manager. These guidelines provide the parameters within which the investment managers agree to operate, including criteria that determine eligible and ineligible securities, diversification requirements and credit quality standards, where applicable. Unless exceptions have been approved, investment managers are prohibited from buying or selling commodities, futures or option contracts, as well as from short selling of securities. Furthermore, investment managers agree to obtain written approval for deviations from stated investment style or guidelines.
As of December 31, 2007, no investment manager was responsible for more than 10 percent of total U.S. plan assets. In addition, diversification requirements for each investment manager prevent a single security or other investment from exceeding 10 percent, at historical cost, of the individual managers portfolio.
The expected long-term rate of return assumption for U.S. plan assets is based upon the target asset allocation and is determined using forward-looking assumptions in the context of historical returns and volatilities for each asset class, as well as correlations among asset classes. We evaluate the rate of return assumption on an annual basis. The expected long-term rate of return assumption used in computing 2007 net periodic pension cost for the U.S. plans was 8.5 percent. As of December 31, 2007, the 10-year annualized return on U.S. plan assets was 8.3 percent, the 15-year annualized return was 11.2 percent, and the annualized return since inception was 12.7 percent.
Plan assets for our pension plans outside the United States are insignificant on an individual plan basis.
110
Table of Contents
THE COCA-COLA COMPANY AND SUBSIDIARIES
NOTES TO CONSOLIDATED FINANCIAL STATEMENTS
NOTE 16: PENSION AND OTHER POSTRETIREMENT BENEFIT PLANS (Continued)
Other Benefit Plans
Plan assets associated with other benefits represent funding of the primary U.S. postretirement benefit plans. In late 2006, we established and contributed $216 million to a U.S. Voluntary Employee Beneficiary Association (VEBA), a tax-qualified trust. While the VEBA assets will remain segregated from the primary U.S. pension master trust, the current investments were determined in a methodology similar to that applied to the U.S. pension plans described above.
Cash Flows
Information about the expected cash flows for our pension and other postretirement benefit plans is as follows (in millions):
| Pension Benefits |
Other Benefits |
|||||
| Expected employer contributions: |
||||||
| 2008 |
$ | 52 | $ | 1 | ||
| Expected benefit payments1: |
||||||
| 2008 |
$ | 185 | $ | 32 | ||
| 2009 |
168 | 34 | ||||
| 2010 |
179 | 37 | ||||
| 2011 |
177 | 40 | ||||
| 2012 |
185 | 42 | ||||
| 2013-2017 |
1,083 | 208 | ||||
| 1 |
The expected benefit payments for our other postretirement benefit plans are net of estimated federal subsidies expected to be received under the Medicare Prescription Drug, Improvement and Modernization Act of 2003. Federal subsidies are estimated to be approximately $2 million in 2008 to 2012 and estimated to be approximately $15 million for the period 2013-2017. |
Defined Contribution Plans
Our Company sponsors qualified defined contribution plans covering substantially all U.S. employees. Under the primary plan, we match 100 percent of participants contributions up to a maximum of 3 percent of compensation. Company contributions to the U.S. plan were approximately $29 million, $25 million and $21 million in 2007, 2006 and 2005, respectively. We also sponsor defined contribution plans in certain locations outside the United States. Company contributions to those plans were approximately $25 million, $16 million and $14 million in 2007, 2006 and 2005, respectively.
111
Table of Contents
THE COCA-COLA COMPANY AND SUBSIDIARIES
NOTES TO CONSOLIDATED FINANCIAL STATEMENTS
NOTE 17: INCOME TAXES
Income before income taxes consisted of the following (in millions):
| Year Ended December 31, | 2007 | 2006 | 2005 | ||||||
| United States |
$ | 2,545 | $ | 2,126 | $ | 2,268 | |||
| International |
5,328 | 4,452 | 4,422 | ||||||
| $ | 7,873 | $ | 6,578 | $ | 6,690 | ||||
Income tax expense (benefit) consisted of the following for the years ended December 31, 2007, 2006 and 2005 (in millions):
| United States |
State and Local |
International | Total | ||||||||||||
| 2007 |
|||||||||||||||
| Current |
$ | 664 | $ | 75 | $ | 1,044 | $ | 1,783 | |||||||
| Deferred |
98 | (13 | ) | 24 | 109 | ||||||||||
| 2006 |
|||||||||||||||
| Current |
$ | 608 | $ | 47 | $ | 878 | $ | 1,533 | |||||||
| Deferred |
(20 | ) | (22 | ) | 7 | (35 | ) | ||||||||
| 2005 |
|||||||||||||||
| Current |
$ | 873 | $ | 188 | $ | 845 | $ | 1,906 | |||||||
| Deferred |
(72 | ) | (25 | ) | 9 | (88 | ) | ||||||||
We made income tax payments of approximately $1,596 million, $1,601 million and $1,676 million in 2007, 2006 and 2005, respectively.
112
Table of Contents
THE COCA-COLA COMPANY AND SUBSIDIARIES
NOTES TO CONSOLIDATED FINANCIAL STATEMENTS
NOTE 17: INCOME TAXES (Continued)
A reconciliation of the statutory U.S. federal tax rate and effective tax rates is as follows:
| Year Ended December 31, | 2007 | 2006 | 2005 | ||||||
| Statutory U.S. federal tax rate |
35.0 | % | 35.0 | % | 35.0 | % | |||
| State and local income taxesnet of federal benefit |
0.6 | 0.7 | 1.2 | ||||||
| Earnings in jurisdictions taxed at rates different from the statutory U.S. federal rate |
(10.8 | )1,2 | (11.4 | )7 | (12.1 | )11 | |||
| Equity income or loss |
(1.3 | )3,4 | (0.6 | )8 | (2.3 | ) | |||
| Other operating charges |
0.5 | 5 | 0.6 | 9 | 0.4 | 12 | |||
| Othernet |
0.0 | 6 | (1.5 | )10 | 0.3 | 13 | |||
| Repatriation under the Jobs Creation Act |
| | 4.7 | 14 | |||||
| Effective tax rates |
24.0 | % | 22.8 | % | 27.2 | % |
| 1 |
Includes approximately $19 million (or 0.2 percent) tax benefit related to tax rate change in Germany. |
| 2 |
Includes approximately $85 million (or 1.1 percent) tax charge related to amounts required to be recorded for changes to our uncertain tax positions under Interpretation No. 48, including interest and penalties, in various international jurisdictions. |
| 3 |
Includes approximately 0.4 percent impact to our effective tax rate related to charges recorded by our equity method investments. Refer to Note 3 and Note 19. |
| 4 |
Includes approximately 0.4 percent impact to our effective tax rate related to the sale of a portion of our investment in Coca-Cola Amatil and the sale of our investment in Vonpar. Refer to Note 3 and Note 19. |
| 5 |
Includes approximately 0.5 percent impact to our effective tax rate related to the impairment of assets and investments in our bottling operations and other restructuring charges. Refer to Note 18. |
| 6 |
Includes approximately $11 million (or 0.1 percent) tax charge related to amounts required to be recorded for changes to our uncertain tax positions under Interpretation No. 48, including interest and penalties, in certain domestic jurisdictions. |
| 7 |
Includes approximately $24 million (or 0.4 percent) tax charge related to the resolution of certain tax matters in various international jurisdictions. |
| 8 |
Includes approximately 2.4 percent impact to our effective tax rate related to charges recorded by our equity method investees. Refer to Note 3 and Note 19. |
| 9 |
Includes the tax rate impact related to the impairment of assets and investments in our bottling operations, contract termination costs related to production capacity efficiencies and other restructuring charges. Refer to Note 19. |
| 10 |
Includes approximately 1.8 percent tax rate benefit related to the sale of a portion of our investment in Coca-Cola FEMSA and Coca-Cola Icecek. Refer to Note 3 and Note 19. |
| 11 |
Includes approximately $29 million (or 0.4 percent) tax benefit related to the favorable resolution of certain tax matters in various international jurisdictions. |
| 12 |
Includes approximately $4 million tax benefit related to the Philippines impairment charges. Refer to Note 19. |
| 13 |
Includes approximately $72 million (or 1.1 percent) tax benefit related to the favorable resolution of certain domestic tax matters. |
| 14 |
Related to repatriation of approximately $6.1 billion of previously unremitted foreign earnings under the Jobs Creation Act, resulting in a tax provision of approximately $315 million. |
113
Table of Contents
THE COCA-COLA COMPANY AND SUBSIDIARIES
NOTES TO CONSOLIDATED FINANCIAL STATEMENTS
NOTE 17: INCOME TAXES (Continued)
Our effective tax rate reflects the tax benefits from having significant operations outside the United States that are taxed at rates lower than the statutory U.S. rate of 35 percent. During 2007, the Company had several subsidiaries that benefited from various tax incentive grants. The terms of these grants range from 2010 to 2031. The Company expects each of the grants to be renewed indefinitely. The grants did not have a material effect on the results of operations for the years ended December 31, 2007, 2006 or 2005.
The Company or one of its subsidiaries files income tax returns in the U.S. federal jurisdiction and various states and foreign jurisdictions. U.S. tax authorities have completed their federal income tax examinations for all years prior to 2005.
With respect to state and local jurisdictions and countries outside the United States, with limited exceptions, the Company and its subsidiaries are no longer subject to income tax audits for years before 2001. Although the outcome of tax audits is always uncertain, the Company believes that adequate amounts of tax, including interest and penalties, have been provided for any adjustments that are expected to result from those years.
The Company adopted the provisions of Interpretation No. 48, effective January 1, 2007. As a result of the implementation of Interpretation No. 48, the Company recorded an approximate $65 million increase in liabilities for unrecognized tax benefits, which was accounted for as a reduction to the January 1, 2007, balance of reinvested earnings. As of December 31, 2007, the gross amount of unrecognized tax benefits was approximately $643 million. If the Company were to prevail on all uncertain tax positions, the net effect would be a benefit to the Companys effective tax rate of approximately $147 million, exclusive of any benefits related to interest and penalties. The remaining approximately $496 million, which was recorded as a deferred tax asset, primarily represents tax benefits that would be received in different tax jurisdictions in the event that the Company did not prevail on all uncertain tax positions. A reconciliation of the changes in the gross balance of unrecognized tax benefits amounts during 2007 follows:
| Year Ended December 31, | 2007 | |||
| Beginning balance of unrecognized tax benefit |
$ | 511 | ||
| Increases related to prior period tax positions |
22 | |||
| Increases due to current period tax positions |
51 | |||
| Decreases related to settlements with taxing authorities |
(4 | ) | ||
| Reductions as a result of a lapse of the applicable statute of limitations |
(1 | ) | ||
| Increases/(decreases) from effects of exchange rates |
64 | |||
| Ending balance of unrecognized tax benefits |
$ | 643 | ||
The Company recognizes accrued interest and penalties related to unrecognized tax benefits in income tax expense. As of December 31, 2007, the Company had approximately $272 million in interest and penalties related to unrecognized tax benefits accrued, of which approximately $82 million was recognized through tax expense in 2007. If the Company were to prevail on all uncertain tax positions, the reversal of this accrual would also be a benefit to the Companys effective tax rate.
It is reasonably possible that the amount of unrecognized benefit with respect to certain of our unrecognized tax positions will significantly change within the next twelve months. These changes may be the result of settlement of ongoing audits, competent authority proceedings related to transfer pricing, or final settlements in transfer pricing matters that are the subject of litigation. At this time, an estimate of the range of the reasonably possible outcomes cannot be made.
114
Table of Contents
THE COCA-COLA COMPANY AND SUBSIDIARIES
NOTES TO CONSOLIDATED FINANCIAL STATEMENTS
NOTE 17: INCOME TAXES (Continued)
Undistributed earnings of the Companys foreign subsidiaries amounted to approximately $11.9 billion at December 31, 2007. Those earnings are considered to be indefinitely reinvested and, accordingly, no U.S. federal and state income taxes have been provided thereon. Upon distribution of those earnings in the form of dividends or otherwise, the Company would be subject to both U.S. income taxes (subject to an adjustment for foreign tax credits) and withholding taxes payable to the various foreign countries. Determination of the amount of unrecognized deferred U.S. income tax liability is not practical because of the complexities associated with its hypothetical calculation; however, unrecognized foreign tax credits would be available to reduce a portion of the U.S. tax liability.
As discussed in Note 1, the Jobs Creation Act was enacted in October 2004. One of the provisions provides a one-time benefit related to foreign tax credits generated by equity investments in prior years. The Company recorded an income tax benefit of approximately $50 million as a result of this law change in 2004. The Jobs Creation Act also included a temporary incentive for U.S. multinationals to repatriate foreign earnings at an approximate 5.25 percent effective tax rate. During the first quarter of 2005, the Company decided to repatriate approximately $2.5 billion in previously unremitted foreign earnings. Therefore, the Company recorded a provision for taxes on such previously unremitted foreign earnings of approximately $152 million in the first quarter of 2005. During 2005, the United States Internal Revenue Service and the United States Department of Treasury issued additional guidance related to the Jobs Creation Act. As a result of this guidance, the Company reduced the accrued taxes previously provided on such unremitted earnings by $25 million in the second quarter of 2005. During the fourth quarter of 2005, the Company repatriated an additional $3.6 billion, with an associated tax liability of approximately $188 million. Therefore, the total previously unremitted earnings that were repatriated during the full year of 2005 was $6.1 billion with an associated tax liability of approximately $315 million. This liability was recorded in 2005 as federal and state and local tax expenses in the amount of $301 million and $14 million, respectively.
115
Table of Contents
THE COCA-COLA COMPANY AND SUBSIDIARIES
NOTES TO CONSOLIDATED FINANCIAL STATEMENTS
NOTE 17: INCOME TAXES (Continued)
The tax effects of temporary differences and carryforwards that give rise to deferred tax assets and liabilities consist of the following (in millions):
| December 31, | 2007 | 2006 | ||||||
| Deferred tax assets: |
||||||||
| Property, plant and equipment |
$ | 45 | $ | 58 | ||||
| Trademarks and other intangible assets |
76 | 75 | ||||||
| Equity method investments (including translation adjustment) |
238 | 354 | ||||||
| Other liabilities |
845 | 190 | ||||||
| Benefit plans |
881 | 1,056 | ||||||
| Net operating/capital loss carryforwards |
554 | 593 | ||||||
| Other |
266 | 224 | ||||||
| Gross deferred tax assets |
2,905 | 2,550 | ||||||
| Valuation allowances |
(611 | ) | (678 | ) | ||||
| Total deferred tax assets1,2 |
$ | 2,294 | $ | 1,872 | ||||
| Deferred tax liabilities: |
||||||||
| Property, plant and equipment |
$ | (670 | ) | $ | (630 | ) | ||
| Trademarks and other intangible assets |
(1,925 | ) | (504 | ) | ||||
| Equity method investments (including translation adjustment) |
(841 | ) | (622 | ) | ||||
| Other liabilities |
(90 | ) | (82 | ) | ||||
| Benefit plans |
(226 | ) | (190 | ) | ||||
| Other |
(157 | ) | (200 | ) | ||||
| Total deferred tax liabilities3 |
$ | (3,909 | ) | $ | (2,228 | ) | ||
| Net deferred tax liabilities |
$ | (1,615 | ) | $ | (356 | ) | ||
| 1 |
Noncurrent deferred tax assets of $66 million and $168 million were included in the consolidated balance sheets line item other assets at December 31, 2007 and 2006, respectively. |
| 2 |
Current deferred tax assets of $238 million and $117 million were included in the consolidated balance sheets line item prepaid expenses and other assets at December 31, 2007 and 2006, respectively. |
| 3 |
Current deferred tax liabilities of $29 million and $33 million were included in the consolidated balance sheets line item accounts payable and accrued expenses at December 31, 2007 and 2006, respectively. |
As of December 31, 2007 and 2006, we had approximately $610 million and $93 million, respectively, of net deferred tax liabilities located in countries outside the United States.
116
Table of Contents
THE COCA-COLA COMPANY AND SUBSIDIARIES
NOTES TO CONSOLIDATED FINANCIAL STATEMENTS
NOTE 17: INCOME TAXES (Continued)
As of December 31, 2007, we had approximately $2,827 million of loss carryforwards available to reduce future taxable income. Loss carryforwards of approximately $207 million must be utilized within the next five years, $67 million must be utilized within the next 10 years, and the remainder can be utilized over a period greater than 10 years.
An analysis of our deferred tax asset valuation allowances is as follows (in millions):
| Year Ended December 31, | 2007 | 2006 | 2005 | |||||||||
| Balance, beginning of year |
$ | 678 | $ | 786 | $ | 854 | ||||||
| Additions |
201 | 50 | 43 | |||||||||
| Deductions |
(268 | ) | (158 | ) | (111 | ) | ||||||
| Balance, end of year |
$ | 611 | $ | 678 | $ | 786 | ||||||
The Companys deferred tax asset valuation allowances are primarily the result of uncertainties regarding the future realization of recorded tax benefits on tax loss carryforwards from operations in various jurisdictions. In 2007, the Company recognized a net decrease in its valuation allowances of $67 million. This decrease was primarily related to the reversal of valuation allowances on deferred tax assets recorded on the basis difference in equity investments. The Company also recognized a decrease in certain deferred tax assets and corresponding valuation allowances related to a change in German tax rates. In 2006, the Company recognized a net decrease in its valuation allowances of $108 million. This decrease was primarily related to the reversal of valuation allowances that covered certain deferred tax assets recorded on capital loss carryforwards. A portion of the capital loss carryforwards was utilized to offset taxable gains on the sale of a portion of the investments in Coca-Cola Icecek and Coca-Cola FEMSA. In 2005, the Company recognized a decrease in its valuation allowances of $68 million. This decrease was primarily related to a change in tax rates which resulted in a reduction of certain deferred tax assets and corresponding valuation allowances.
NOTE 18: RESTRUCTURING COSTS
During 2007, the Company took steps to streamline and simplify its operations globally. In North America, the Company reorganized its operations around three main business units: Sparkling Beverages, Still Beverages and Emerging Brands. In Ireland, the Company announced a plan to close its beverage concentrate manufacturing and distribution plant in Drogheda in September 2008. The plant closure is expected to improve operating productivity and enhance capacity utilization. The costs associated with this plant closure are included in the Corporate segment. Selected other operations also took steps to streamline their operations to improve overall efficiency and effectiveness.
Employees separated or to be separated from the Company as a result of these streamlining initiatives were offered severance or early retirement packages, as appropriate, that included both financial and nonfinancial components. The expenses recorded during the year ended December 31, 2007 included costs related to involuntary terminations and other direct costs associated with implementing these initiatives. Other direct costs included expenses to relocate employees; contract termination costs; costs associated with the development, communication and administration of these initiatives; accelerated depreciation; and asset write-offs. During 2007, the Company incurred total pretax expenses related to these streamlining initiatives of approximately $237 million. These expenses were primarily recorded in the line item other operating charges in our consolidated statement of income. The Company currently expects the total cost of these initiatives to be approximately $342 million. The Company expects to expense the remainder of the costs in 2008. The remaining costs primarily relate to severance pay and benefits and accelerated depreciation related to the closing of the Drogheda Plant.
117
Table of Contents
THE COCA-COLA COMPANY AND SUBSIDIARIES
NOTES TO CONSOLIDATED FINANCIAL STATEMENTS
NOTE 18: RESTRUCTURING COSTS (Continued)
The table below summarizes the balance of accrued streamlining expenses, which is included in the balance of accounts payable and accrued expenses in the consolidated balance sheets, and the changes in the accrued amounts as of and for the year ended December 31, 2007 (in millions):
| Costs Incurred in 2007 |
Payments | Noncash and Exchange |
Accrued Balance December 31, 2007 |
|||||||||||
| Severance pay and benefits |
$ | 148 | $ | (72 | ) | $ | 2 | $ | 78 | |||||
| Outside serviceslegal, outplacement, consulting |
4 | (3 | ) | | 1 | |||||||||
| Other direct costs |
85 | (8 | ) | (61 | ) | 16 | ||||||||
| Total |
$ | 237 | $ | (83 | ) | $ | (59 | ) | $ | 95 | ||||
The total streamlining initiative costs incurred by operating segment were as follows (in millions):
| Year Ended December 31, | 2007 | ||
| Africa |
$ | 33 | |
| Eurasia |
3 | ||
| European Union |
33 | ||
| Latin America |
4 | ||
| North America |
23 | ||
| Pacific |
3 | ||
| Bottling Investments |
29 | ||
| Corporate |
109 | ||
| Total |
$ | 237 | |
NOTE 19: SIGNIFICANT OPERATING AND NONOPERATING ITEMS
During 2007, our Company recorded restructuring charges of approximately $237 million (refer to Note 18) and asset write-downs totaling approximately $31 million related to certain assets and investments in bottling operations, none of which was individually significant. Of this total, approximately $14 million was recorded in cost of goods sold, and approximately $254 million was recorded in other operating charges in our consolidated statement of income.
In 2007, the Company sold a portion of its interest in Coca-Cola Amatil for proceeds of approximately $143 million. As a result of this transaction, we recognized a pretax gain of approximately $73 million, which impacted the Corporate operating segment and was included in other income (loss)net in our consolidated statement of income. Refer to Note 3.
During 2007, the Company sold substantially all of its interest in Vonpar. Total proceeds from the sale were approximately $238 million, and we recognized a pretax gain on this sale of approximately $70 million, which impacted the Corporate operating segment and was included in other income (loss)net in our consolidated statement of income. Refer to Note 3.
In 2007, the Company recorded pretax gains of approximately $66 million and $18 million resulting from the sales of real estate in Spain and the United States, respectively. The gains were included in other income (loss)net in the consolidated statement of income and impacted the Corporate operating segment. Total proceeds amounted to approximately $106 million.
118
Table of Contents
THE COCA-COLA COMPANY AND SUBSIDIARIES
NOTES TO CONSOLIDATED FINANCIAL STATEMENTS
NOTE 19: SIGNIFICANT OPERATING AND NONOPERATING ITEMS (Continued)
Equity income in 2007 was reduced by approximately $99 million in the Bottling Investments operating segment related to our proportionate share of asset write-downs recorded by CCBPI. The asset write-downs primarily related to excess and obsolete bottles and cases at CCBPI. Refer to Note 3.
In 2007, our equity income was also reduced by approximately $62 million in the Bottling Investments operating segment related to our proportionate share of an impairment recorded by Coca-Cola Amatil as a result of the sale of its bottling operations in South Korea. Refer to Note 3.
Equity income was increased in 2007 by approximately $11 million in the Bottling Investments operating segment, primarily consisting of our proportionate share of tax benefits recorded by CCE, partially offset by our proportionate share of restructuring charges recorded by CCE. Refer to Note 3.
In 2006, our Company recorded charges of approximately $606 million related to our proportionate share of charges recorded by our equity method investees. Of this amount, approximately $602 million related to our proportionate share of an impairment charge recorded by CCE for its North American franchise rights. Our proportionate share of CCEs charges also included approximately $18 million due to restructuring charges recorded by CCE. These charges were partially offset by approximately $33 million related to our proportionate share of changes in certain of CCEs state and Canadian federal and provincial tax rates. The charges were recorded in the line item equity incomenet in the consolidated statement of income. All of these charges and changes impacted our Bottling Investments operating segment. Refer to Note 3.
During 2006, our Company also recorded charges of approximately $112 million, primarily related to the impairment of assets and investments in our bottling operations, approximately $53 million for contract termination costs related to production capacity efficiencies and approximately $24 million related to other restructuring costs. These charges impacted the Africa, the European Union, the Pacific, the Bottling Investments and the Corporate operating segments. None of these charges was individually significant. Approximately $4 million of these charges was recorded in the line item cost of goods sold and approximately $185 million of these charges was recorded in the line item other operating charges in the consolidated statement of income. Refer to Note 21.
The Company made a $100 million donation to The Coca-Cola Foundation in 2006, which resulted in a charge to the consolidated statement of income line item selling, general and administrative expenses and impacted the Corporate operating segment.
In 2006, the Company sold a portion of its Coca-Cola FEMSA shares to FEMSA and recorded a pretax gain of approximately $175 million in the consolidated statement of income line item other income (loss)net, which impacted the Corporate operating segment. Refer to Note 3.
The Company sold a portion of our investment in Coca-Cola Icecek in an initial public offering in 2006. Our Company received net cash proceeds of approximately $198 million and realized a pretax gain of approximately $123 million, which was recorded as other income (loss)net in the consolidated statement of income and impacted the Corporate operating segment. Refer to Note 3.
In 2005, our Company received approximately $109 million related to the settlement of a class action lawsuit concerning price-fixing in the sale of HFCS purchased by the Company during the years 1991 to 1995. Subsequent to the receipt of this settlement amount, the Company distributed approximately $62 million to certain bottlers in North America. From 1991 to 1995, the Company purchased HFCS on behalf of these bottlers. Therefore, these bottlers were
119
Table of Contents
THE COCA-COLA COMPANY AND SUBSIDIARIES
NOTES TO CONSOLIDATED FINANCIAL STATEMENTS
NOTE 19: SIGNIFICANT OPERATING AND NONOPERATING ITEMS (Continued)
ultimately entitled to a portion of the proceeds of the settlement. Of the approximately $62 million we distributed to certain bottlers in North America, approximately $49 million was distributed to CCE. The Companys remaining share of the settlement was approximately $47 million, which was recorded as a reduction of cost of goods sold and impacted the Corporate operating segment.
During 2005, we recorded approximately $23 million of noncash pretax gains on the issuances of stock by equity method investees. Refer to Note 4.
The Company recorded approximately $50 million of expense in 2005 as a result of a change in our estimated service period for the acceleration of certain stock-based compensation awards. Refer to Note 15.
Equity income in 2005 was reduced by approximately $33 million for the Bottling Investments operating segment, primarily related to our proportionate share of the tax liability recorded by CCE resulting from its repatriation of previously unremitted foreign earnings under the Jobs Creation Act, as well as our proportionate share of restructuring charges. Those amounts were partially offset by our proportionate share of CCEs HFCS lawsuit settlement proceeds and changes in certain of CCEs state and provincial tax rates. Refer to Note 3.
Our Company recorded impairment charges during 2005 of approximately $84 million related to certain trademarks for beverages sold in the Philippines and approximately $1 million related to impairment of other assets. These impairment charges were recorded in the consolidated statement of income line item other operating charges.
NOTE 20: ACQUISITIONS AND INVESTMENTS
During 2007, our Companys acquisition and investment activity, including the acquisition of trademarks, totaled approximately $5,653 million.
In the fourth quarter of 2007, the Company and Coca-Cola FEMSA jointly acquired Jugos del Valle, the second largest producer of packaged juices, nectars and fruit-flavored beverages in Mexico and the largest producer of such beverages in Brazil. The purchase price was approximately $370 million plus the assumption of approximately $85 million in debt and was split equally between the Company and Coca-Cola FEMSA. As of December 31, 2007, the Company owned a 50 percent interest in Jugos del Valle. The Companys investment in Jugos del Valle is accounted for under the equity method. Equity incomenet includes our proportionate share of the results of Jugos del Valles operations beginning November 2007 and is included in the Latin America operating segment.
In order to increase the efficiency of our bottling and distribution operations in the German market, the Company, through its consolidated German bottling operation CCEAG, acquired 18 German bottling and distribution operations on September 1, 2007 for a total purchase price of approximately $660 million. Following the acquisition, the Company owns the franchise rights for all of the German market. The purchase price consisted of approximately 17 percent of the outstanding shares of CCEAG valued at approximately $385 million, approximately $156 million in cash, guaranteed future cash payments valued at approximately $85 million, and assumed debt of approximately $34 million. The acquisition agreements also provide the former owners of the 18 German bottling and distribution operations a put option to sell their respective shares in CCEAG back to the Company on January 2, 2014, with notification to the Company required by September 30, 2013. In addition, the agreements provide the Company with a call option to repurchase the issued shares of CCEAG back from the former owners of the 18 German bottling and distribution operations on January 2, 2014, with notification to the former owners of the 18 German bottlers and distributors by December 15, 2013. The strike price of the call option is approximately 20 percent higher than the strike
120
Table of Contents
THE COCA-COLA COMPANY AND SUBSIDIARIES
NOTES TO CONSOLIDATED FINANCIAL STATEMENTS
NOTE 20: ACQUISITIONS AND INVESTMENTS (Continued)
price of the put option. Upon closing of the acquisition, we made preliminary estimates of the fair values of the assets and liabilities for consolidation. Due to the number of entities involved, our Company is still in the process of determining valuations for many of the assets and liabilities acquired; therefore, the preliminary estimates are subject to adjustment as additional information is obtained. This additional information includes, but is not limited to, valuations and physical counts of property, plant and equipment; valuation models for identifiable intangible assets; adjustments resulting from reviewing the closing balance sheets of the acquired entities; and income tax valuations. Accordingly, subsequent revisions to these preliminary estimates should be expected. As these issues are identified and resolved, adjustments will be made to the preliminary values assigned to the assets and liabilities acquired, including goodwill, which may be material. The preliminary amount of purchase price allocated to franchise rights was approximately $343 million, property, plant and equipment was approximately $251 million, deferred tax liabilities was approximately $99 million, and goodwill was approximately $111 million. Approximately $33 million of the goodwill is deductible for tax purposes. The franchise rights have been assigned an indefinite life. This transaction was accounted for as a business combination, with the results of the 18 German bottling and distribution operations included in the Bottling Investments operating segment since September 1, 2007. Management has begun to formulate a plan to improve the efficiency of the German bottling and distribution operations. As of December 31, 2007, this plan had not yet been finalized.
In the third quarter of 2007, the Company acquired a 34 percent interest in Tokyo CCBC. The Companys investment in Tokyo CCBC is accounted for under the equity method. Equity incomenet includes our proportionate share of the results of Tokyo CCBCs operations beginning July 2007 and is included in the Bottling Investments operating segment. In the third quarter of 2007, the Company also acquired an additional interest in NORSA. After this acquisition, the Company owned approximately 60 percent of NORSA. The Company began consolidating this entity from the date we acquired the additional 11 percent interest. The combined purchase price for these third quarter acquisitions was approximately $203 million. NORSA is included in the Bottling Investments operating segment.
On June 7, 2007, in an effort to expand our still beverage offerings, our Company acquired Energy Brands Inc., also known as glacéau, the maker of enhanced water brands such as vitaminwater, fruitwater and smartwater, and vitaminenergy, for approximately $4.1 billion. On the acquisition date, we made a cash payment of approximately $2.9 billion for a 71.4 percent interest in glacéau and entered into a put and call option agreement with certain entities associated with the Tata Group (Tata) to acquire the remaining 28.6 percent ownership interest in glacéau. As a result of the terms of these agreements with Tata, the amount to be paid under the put and call option agreement of $1.2 billion was recorded at the acquisition date as an additional investment in glacéau, with the offset being recorded as a current liability within loans and notes payable on the consolidated balance sheet. On October 22, 2007, the Company exercised its right to call the remaining interest in glacéau and paid Tata $1.2 billion such that the Company owned 100 percent of glacéau as of December 31, 2007. Under the purchase method of accounting, the total purchase price of glacéau is allocated to the tangible assets, liabilities and identifiable intangible assets acquired based on their estimated fair values. Any excess of purchase price over the aggregate fair value of acquired net assets is recorded as goodwill. Based upon a preliminary purchase price allocation, using information currently available, the Company allocated approximately $2.8 billion to trademarks, approximately $2.2 billion to goodwill, approximately $0.2 billion to customer relationships and approximately $0.9 billion to deferred tax liabilities. The trademarks have been assigned indefinite lives. The goodwill resulting from this acquisition is primarily related to our ability to optimize the route to market and increase the availability of the product, which will result in additional product sales. The goodwill also includes the recognition of deferred tax liabilities associated with the identifiable intangible assets recorded in purchase accounting. The goodwill is not deductible for tax purposes. These purchase price allocations are preliminary estimates and are subject to change as additional information is obtained. Some of these changes could be material. Some of the
121
Table of Contents
THE COCA-COLA COMPANY AND SUBSIDIARIES
NOTES TO CONSOLIDATED FINANCIAL STATEMENTS
NOTE 20: ACQUISITIONS AND INVESTMENTS (Continued)
additional information the Company expects to obtain includes, among other things, valuations of property, plant and equipment and identifiable intangible assets. On August 30, 2007, the Company announced its plans to transition to a new distribution model for glacéau products. This new distribution model includes a mix of current glacéau distributors and existing Coca-Cola system bottlers. Also, the Company will retain the distribution rights for certain channels. The implementation of this plan resulted in approximately $0.2 billion in liabilities for anticipated costs to terminate existing glacéau distribution agreements, which was reflected as an adjustment to the original allocation of acquisition costs. The Company completed the majority of the transition in the fourth quarter of 2007, and anticipates the remainder to be completed in the first half of 2008. The Company paid out approximately half of its originally accrued liability to former glacéau distributors as of December 31, 2007. The acquisition of glacéau was accounted for as a business combination, with the results of the acquired entity included in the North America operating segment as of the acquisition date.
In addition, certain executive officers and former shareholders of glacéau invested approximately $179 million of their proceeds from the sale of glacéau in common stock of the Company at then current market prices. These shares of Company common stock were placed in escrow pursuant to the glacéau acquisition agreement.
As discussed below, in the second quarter of 2007, the Company divested a portion of its interest in Scarlet Ibis Investment 3 (Proprietary) Limited (Scarlet), a bottling company in South Africa.
During the first quarter of 2007, our Company acquired the remaining 65 percent interest in CCBPI from San Miguel Corporation (SMC) for consideration of approximately $591 million plus assumed net debt, of which $100 million was placed in escrow until certain matters related to the closing balance sheet audit of CCBPI were resolved. During the third quarter of 2007, the entire escrow amount was released, and our Company recovered $70 million. The adjusted purchase price after the recovery from escrow was approximately $521 million plus assumed debt, net of acquired cash, of approximately $79 million. Of the $521 million of consideration, the Company has outstanding notes payable to SMC for approximately $120 million. As a result of the acquisition, the Company owns 100 percent of the outstanding stock of CCBPI. Upon closing of the acquisition, we made preliminary estimates of the fair values of the assets and liabilities for consolidation. Our Company has prepared valuations for many of the assets and liabilities acquired, and the preliminary estimates have been adjusted accordingly. The preliminary amount of purchase price allocated to property, plant and equipment was approximately $319 million, franchise rights was approximately $354 million and goodwill was approximately $152 million. The goodwill is not deductible for tax purposes. Future adjustments necessary to finalize the purchase accounting are not expected to be significant. The franchise rights have been assigned an indefinite life. CCBPI is included in the Bottling Investments operating segment. Management finalized a plan to improve the efficiency of CCBPI, which included the closing of eight production facilities during the third quarter of 2007. The acquisition of CCBPI was accounted for as a business combination, with the results of the acquired entity included in the Bottling Investments operating segment as of the acquisition date.
First quarter 2007 acquisition and investing activities also included approximately $327 million related to the purchase of Fuze Beverage, LLC (Fuze), maker of Fuze enhanced juices and teas in the U.S., and Leao Junior S.A. (Leao Junior), a Brazilian herbal beverage company. The preliminary amount of purchase price related to these acquisitions allocated to property, plant and equipment was approximately $13 million, identifiable intangible assets, primarily trademarks, was approximately $150 million and goodwill was approximately $163 million. The purchase price allocations will be adjusted once additional fair value information is obtained. The acquisitions of Fuze and Leao Junior were accounted for as business combinations, with the results of the acquired entities included in the North America and Latin America operating segments, respectively, as of the acquisition dates.
122
Table of Contents
THE COCA-COLA COMPANY AND SUBSIDIARIES
NOTES TO CONSOLIDATED FINANCIAL STATEMENTS
NOTE 20: ACQUISITIONS AND INVESTMENTS (Continued)
The acquisitions of the 18 German bottling and distribution operations, glacéau, CCBPI, Fuze, Leao Junior, NORSA, our 34 percent investment in Tokyo CCBC and our 50 percent investment in Jugos del Valle in 2007 were primarily financed through the issuance of commercial paper and long-term debt.
Assuming the results of the businesses acquired in 2007 had been included in operations beginning on January 1, 2006, the estimated pro forma net operating revenues of the Company for the years ended December 31, 2007 and 2006 would have been approximately $29.6 billion and $25.9 billion, respectively. The estimated pro forma net income, excluding the effect of interest expense as a result of financing the acquisitions, for the years ended December 31, 2007 and 2006 would not have been significantly different than the reported amounts.
During 2006, our Companys acquisition and investment activity, including the acquisition of trademarks, totaled approximately $901 million. In the third quarter of 2006, our Company acquired a controlling shareholding interest in Kerry Beverages Limited (KBL). KBL was formed by the Company and the Kerry Group in 1993 and has a majority ownership in 11 joint ventures that manufacture and distribute Company products across nine provinces in China. KBL also has a minority interest in the joint venture bottler in Beijing. Subsequent to the acquisition, the Company changed KBLs name to Coca-Cola China Industries Limited (CCCIL). As a result of the transaction, the Company owns 89.5 percent of the outstanding shares of CCCIL, and we have agreed to purchase the remaining 10.5 percent by the end of 2008 at the same price per share as the initial purchase price plus interest. We have all voting and economic rights over the remaining shares. This transaction was accounted for as a business combination, and the results of CCCILs operations have been included in the Companys consolidated financial statements since August 29, 2006. CCCIL is included in the Bottling Investments operating segment.
In the third quarter of 2006, our Company signed agreements with J. Bruce Llewellyn and Brucephil, Inc. (Brucephil), the parent company of The Philadelphia Coca-Cola Bottling Company, for the potential purchase of the remaining shares of Brucephil not currently owned by the Company. The agreements provide for the Companys purchase of the shares upon the election of Mr. Llewellyn or the election of the Company. Based on the terms of these agreements, the Company concluded that it must consolidate Brucephil under Interpretation No. 46(R). Brucephils financial statements were consolidated effective September 29, 2006. Brucephil is included in our Bottling Investments operating segment.
Also in the third quarter of 2006, our Company acquired Apollinaris GmbH (Apollinaris). Apollinaris has been selling sparkling and still mineral water in Germany since 1862. This transaction was accounted for as a business combination, and the results of Apollinaris operations have been included in the Companys consolidated financial statements since July 1, 2006. A portion of Apollinaris business is included in the European Union operating segment, and the balance is included in the Bottling Investments operating segment.
The combined amount paid or to be paid to complete these third quarter 2006 transactions totaled approximately $707 million. As a result of these transactions, the Company recorded approximately $707 million of franchise rights, approximately $74 million of trademarks and approximately $182 million of goodwill. The franchise rights and trademarks have been assigned an indefinite life.
In January 2006, our Company acquired a 100 percent interest in TJC Holdings (Pty) Ltd. (TJC), a bottling company in South Africa, from Chef Limited and Tom Cook Trust for cash consideration of approximately $200 million. Subsequently, the Company renamed TJC as Scarlet. This transaction was accounted for as a business combination, with the results of Scarlet included in the Companys consolidated financial statements since the date of acquisition. In May 2007, Scarlet issued common shares to a Black Economic Empowerment Entity (BEEE) at a price per share equal to the current carrying value of our investment in Scarlet, which was subsequently renamed as
123
Table of Contents
THE COCA-COLA COMPANY AND SUBSIDIARIES
NOTES TO CONSOLIDATED FINANCIAL STATEMENTS
NOTE 20: ACQUISITIONS AND INVESTMENTS (Continued)
Shanduka Beverages (Proprietary) Limited (Shanduka). This issuance reduced the Companys ownership interest in Shanduka to 30 percent. As a result of subordinated financial support provided by the Company for the BEEE to complete this transaction, the Company concluded that we must continue to consolidate Shandukas operations under Interpretation No. 46(R). Shanduka is included in our Bottling Investments operating segment.
Assuming the results of the businesses acquired in 2006 had been included in operations beginning on January 1, 2005, pro forma financial data would not be required for 2005 or 2006 due to immateriality.
During 2005, our Companys acquisition and investment activity totaled approximately $637 million and included the acquisition of the German bottling company Bremer Erfrischungsgetraenke GmbH (Bremer) for approximately $160 million from InBev SA. This transaction was accounted for as a business combination, and the results of Bremers operations have been included in the Companys consolidated financial statements beginning in September 2005. The Company recorded approximately $54 million of property, plant and equipment, approximately $85 million of franchise rights and approximately $58 million of goodwill related to this acquisition. The franchise rights have been assigned an indefinite life, and the goodwill was allocated to the Germany reporting unit within the European Union operating segment.
In August 2005, we completed the acquisition of the remaining 49 percent interest in the business of CCDA Waters L.L.C. (CCDA) not previously owned by our Company. Our Company and Danone Waters of North America, Inc. (DWNA) had formed CCDA in July 2002 for the production, marketing and distribution of DWNAs bottled spring and source water business in the United States. This transaction was accounted for as a business combination, and the consolidated results of CCDAs operations have been included in the Companys consolidated financial statements since July 2002. CCDA is included in our North America operating segment. In July 2005, the Company acquired Sucos Mais, a Brazilian juice company. The results of Sucos Mais have been included in our consolidated financial statements since July 2005. Sucos Mais is included in our Latin America operating segment.
Assuming the results of our 2005 acquisitions had been included in operations beginning on January 1, 2004, pro forma financial data would not be required due to immateriality.
On April 20, 2005, our Company and Coca-Cola Hellenic jointly acquired Multon for a total purchase price of approximately $501 million, split equally between the Company and Coca-Cola Hellenic. The Companys investment in Multon is accounted for under the equity method. Equity incomenet includes our proportionate share of the results of Multons operations beginning April 20, 2005. Multon is included in our Eurasia operating segment.
124
Table of Contents
THE COCA-COLA COMPANY AND SUBSIDIARIES
NOTES TO CONSOLIDATED FINANCIAL STATEMENTS
NOTE 21: OPERATING SEGMENTS
Effective January 1, 2007, the Company combined the Eurasia and Middle East Division, and the Russia, Ukraine and Belarus Division, both of which were previously included in the North Asia, Eurasia and Middle East operating segment, with the India Division, previously included in the East, South Asia and Pacific Rim operating segment, to form the Eurasia operating segment. In addition, we combined the China Division and the Japan Division, previously included in the North Asia, Eurasia and Middle East operating segment, with the remaining East, South Asia and Pacific Rim operating segment to form the Pacific operating segment. As a result, effective January 1, 2007, our organizational structure consisted of the following operating segments: Africa, Eurasia, European Union, Latin America, North America, Pacific, Bottling Investments and Corporate. Prior-period amounts have been reclassified to conform to the new operating structure described above.
Segment Products and Services
The business of our Company is nonalcoholic beverages. Our operating segments derive a majority of their revenues from the manufacture and sale of beverage concentrates and syrups and, in some cases, the sale of finished beverages.
Method of Determining Segment Income or Loss
Management evaluates the performance of our operating segments separately to individually monitor the different factors affecting financial performance. Our Company manages income taxes and financial costs, such as interest income and expense, on a global basis within the Corporate operating segment. We evaluate segment performance based on income or loss before income taxes.
125
Table of Contents
THE COCA-COLA COMPANY AND SUBSIDIARIES
NOTES TO CONSOLIDATED FINANCIAL STATEMENTS
NOTE 21: OPERATING SEGMENTS (Continued)
Information about our Companys operations by operating segment for the years ended December 31, 2007, 2006 and 2005, is as follows (in millions):
| Africa | Eurasia | European Union |
Latin America |
North America |
Pacific | Bottling Investments |
Corporate | Eliminations | Consolidated | ||||||||||||||||||||||||||||||
| 2007 |
|||||||||||||||||||||||||||||||||||||||
| Net operating revenues: |
|||||||||||||||||||||||||||||||||||||||
| Third party |
$ | 1,273 | $ | 970 | $ | 4,145 | $ | 3,069 | $ | 7,761 | $ | 3,997 | 1 | $ | 7,570 | $ | 72 | $ | | $ | 28,857 | ||||||||||||||||||
| Intersegment |
54 | 114 | 845 | 175 | 75 | 409 | 125 | | (1,797 | ) | | ||||||||||||||||||||||||||||
| Total net revenues |
1,327 | 1,084 | 4,990 | 3,244 | 7,836 | 4,406 | 7,695 | 72 | (1,797 | ) | 28,857 | ||||||||||||||||||||||||||||
| Operating income (loss) |
450 | 2 | 380 | 2 | 2,612 | 2 | 1,749 | 2 | 1,696 | 2 | 1,699 | 2 | 153 | 2 | (1,487 | )2 | | 7,252 | |||||||||||||||||||||
| Interest income |
| | | | | | | 236 | | 236 | |||||||||||||||||||||||||||||
| Interest expense |
| | | | | | | 456 | | 456 | |||||||||||||||||||||||||||||
| Depreciation and amortization |
17 | 7 | 140 | 41 | 359 | 82 | 388 | 129 | | 1,163 | |||||||||||||||||||||||||||||
| Equity incomenet |
| 19 | (7 | ) | 3 | (1 | ) | | 630 | 24 | | 668 | |||||||||||||||||||||||||||
| Income (loss) before income taxes |
441 | 2 | 399 | 2 | 2,615 | 2 | 1,753 | 2 | 1,695 | 2 | 1,680 | 2 | 761 | 2,3 | (1,471 | )2,3 | | 7,873 | |||||||||||||||||||||
| Identifiable operating assets4 |
636 | 437 | 2,947 | 5 | 1,989 | 10,510 | 1,468 | 8,962 | 5 | 8,543 | | 35,492 | |||||||||||||||||||||||||||
| Investments6 |
2 | 394 | 78 | 243 | 11 | 9 | 6,949 | 91 | | 7,777 | |||||||||||||||||||||||||||||
| Capital expenditures |
39 | 38 | 76 | 47 | 344 | 191 | 645 | 268 | | 1,648 | |||||||||||||||||||||||||||||
| 2006 |
|||||||||||||||||||||||||||||||||||||||
| Net operating revenues: |
|||||||||||||||||||||||||||||||||||||||
| Third party |
$ | 1,103 | $ | 791 | $ | 3,660 | $ | 2,484 | $ | 7,013 | $ | 3,990 | 1 | $ | 4,954 | $ | 93 | $ | | $ | 24,088 | ||||||||||||||||||
| Intersegment |
37 | 86 | 704 | 132 | 16 | 128 | 89 | | (1,192 | ) | | ||||||||||||||||||||||||||||
| Total net revenues |
1,140 | 877 | 4,364 | 2,616 | 7,029 | 4,118 | 5,043 | 93 | (1,192 | ) | 24,088 | ||||||||||||||||||||||||||||
| Operating income (loss) |
424 | 7 | 275 | 2,254 | 7 | 1,438 | 1,683 | 1,650 | 7 | 18 | 7 | (1,434 | )7,8 | | 6,308 | ||||||||||||||||||||||||
| Interest income |
| | | | | | | 193 | | 193 | |||||||||||||||||||||||||||||
| Interest expense |
| | | | | | | 220 | | 220 | |||||||||||||||||||||||||||||
| Depreciation and amortization |
16 | 8 | 100 | 25 | 361 | 60 | 278 | 90 | | 938 | |||||||||||||||||||||||||||||
| Equity incomenet |
| 27 | (4 | ) | | | | 56 | 9 | 23 | | 102 | |||||||||||||||||||||||||||
| Income (loss) before income taxes |
413 | 7 | 302 | 2,258 | 7 | 1,434 | 1,681 | 1,644 | 7 | 67 | 7,9 | (1,221 | )7,8,10 | | 6,578 | ||||||||||||||||||||||||
| Identifiable operating assets4 |
572 | 314 | 2,557 | 5 | 1,516 | 4,778 | 1,120 | 5,953 | 5 | 6,370 | | 23,180 | |||||||||||||||||||||||||||
| Investments6 |
| 348 | 64 | | 2 | 7 | 6,302 | 60 | | 6,783 | |||||||||||||||||||||||||||||
| Capital expenditures |
37 | 6 | 93 | 44 | 421 | 133 | 418 | 255 | | 1,407 | |||||||||||||||||||||||||||||
| 2005 |
|||||||||||||||||||||||||||||||||||||||
| Net operating revenues: |
|||||||||||||||||||||||||||||||||||||||
| Third party |
$ | 1,107 | $ | 650 | $ | 4,260 | $ | 2,064 | $ | 6,676 | $ | 4,158 | 1 | $ | 4,106 | $ | 83 | $ | | $ | 23,104 | ||||||||||||||||||
| Intersegment |
13 | 75 | 651 | 94 | | 115 | | | (948 | ) | | ||||||||||||||||||||||||||||
| Total net revenues |
1,120 | 725 | 4,911 | 2,158 | 6,676 | 4,273 | 4,106 | 83 | (948 | ) | 23,104 | ||||||||||||||||||||||||||||
| Operating income (loss) |
396 | 11 | 198 | 11 | 2,219 | 11 | 1,176 | 11 | 1,553 | 11 | 1,821 | 11,12 | (37 | ) | (1,241 | )11,13 | | 6,085 | |||||||||||||||||||||
| Interest income |
| | | | | | | 235 | | 235 | |||||||||||||||||||||||||||||
| Interest expense |
| | | | | | | 240 | | 240 | |||||||||||||||||||||||||||||
| Depreciation and amortization |
18 | 11 | 86 | 27 | 348 | 48 | 265 | 129 | | 932 | |||||||||||||||||||||||||||||
| Equity incomenet |
| 20 | | | | | 624 | 14 | 36 | | 680 | ||||||||||||||||||||||||||||
| Income (loss) before income taxes |
382 | 11 | 217 | 11 | 2,225 | 11 | 1,175 | 11 | 1,549 | 11 | 1,814 | 11,12 | 590 | 14 | (1,262 | )11,13,15 | | 6,690 | |||||||||||||||||||||
| Identifiable operating assets4 |
561 | 329 | 2,182 | 5 | 1,324 | 4,645 | 998 | 3,842 | 5 | 8,624 | | 22,505 | |||||||||||||||||||||||||||
| Investments6 |
| 275 | 16 | 6 | | 7 | 6,538 | 80 | | 6,922 | |||||||||||||||||||||||||||||
| Capital expenditures |
23 | 5 | 78 | 24 | 265 | 91 | 264 | 149 | | 899 | |||||||||||||||||||||||||||||
Certain prior year amounts have been revised to conform to the current year presentation.
| 1 |
Net operating revenues in Japan represented approximately 9 percent of total consolidated net operating revenues in 2007, 11 percent in 2006 and 13 percent in 2005. |
| 2 |
Operating income (loss) and income (loss) before income taxes were reduced by approximately $34 million for Africa, $3 million for Eurasia, $33 million for European Union, $4 million for Latin America, $23 million for North America, $3 million for Pacific, $47 million for Bottling Investments and $121 million for Corporate primarily due to asset write-downs and restructuring costs. Refer to Note 18. |
| 3 |
Income (loss) before income taxes was decreased by approximately $150 million for Bottling Investments primarily due to our proportionate share of asset write-downs and restructuring costs, net of benefits from tax rate changes, recorded by equity method investees and was increased by $227 million for Corporate primarily due to gains on the sale of real estate in Spain and in the United States, the sale of our ownership in Vonpar and the sale of Coca-Cola Amatil shares. Refer to Note 19. |
| 4 |
Principally cash and cash equivalents, marketable securities, finance subsidiary receivables, goodwill, trademarks and other intangible assets and property, plant and equipmentnet. |
126
Table of Contents
THE COCA-COLA COMPANY AND SUBSIDIARIES
NOTES TO CONSOLIDATED FINANCIAL STATEMENTS
NOTE 21: OPERATING SEGMENTS (Continued)
| 5 |
Property, plant and equipmentnet in Germany represented approximately 21 percent of total consolidated property, plant and equipmentnet in 2007, 19 percent in 2006 and 19 percent in 2005. |
| 6 |
Principally equity and cost method investments in bottling companies. |
| 7 |
Operating income (loss) and income (loss) before income taxes were reduced by approximately $3 million for Africa, $36 million for the European Union, $62 million for the Pacific, $87 million for Bottling Investments and $1 million for Corporate primarily due to asset impairments, contract termination costs related to production capacity efficiencies and other restructuring costs. Refer to Note 19. |
| 8 |
Operating income (loss) and income (loss) before income taxes were reduced by $100 million for Corporate as a result of a donation made to The Coca-Cola Foundation. Refer to Note 19. |
| 9 |
Equity incomenet and income (loss) before income taxes were reduced by approximately $587 million for Bottling Investments primarily related to our proportionate share of impairment and restructuring charges recorded by CCE which were partially offset by our proportionate share of changes in certain of CCEs state and Canadian federal and provincial tax rates (refer to Note 3 and Note 19), and were reduced by approximately $19 million due to our proportionate share of restructuring charges recorded by other equity method investees. |
| 10 |
Income (loss) before income taxes was increased by approximately $298 million for Corporate as a result of net gains on the sale of Coca-Cola FEMSA shares and the sale of a portion of our investment in Coca-Cola Icecek in an initial public offering. Refer to Note 19. |
| 11 |
Operating income (loss) and income (loss) before income taxes were reduced by approximately $3 million for Africa, $3 million for Eurasia, $3 million for the European Union, $4 million for Latin America, $12 million for North America, $3 million for the Pacific, and $22 million for Corporate as a result of accelerated amortization of stock-based compensation expense due to a change in our estimated service period for retirement-eligible participants. Refer to Note 15. |
| 12 |
Operating income (loss) and income (loss) before income taxes were reduced by approximately $85 million for the Pacific related to the Philippines impairment charges. Refer to Note 19. |
| 13 |
Operating income (loss) and income (loss) before income taxes benefited by approximately $47 million for Corporate related to the settlement of a class action lawsuit related to HFCS purchases. Refer to Note 19. |
| 14 |
Equity incomenet and income (loss) before income taxes were reduced by approximately $33 million for Bottling Investments primarily related to our proportionate share of the tax liability recorded as a result of CCEs repatriation of unremitted foreign earnings under the Jobs Creation Act and restructuring charges, offset by CCEs HFCS lawsuit settlement proceeds and changes in certain of CCEs state and provincial tax rates, and by approximately $4 million due to our proportionate share of impairments of certain intangible assets and investments recorded by an equity method investee in the Philippines. Refer to Note 3 and Note 19. |
| 15 |
Income (loss) before income taxes benefited by approximately $23 million for Corporate due to noncash pretax gains on issuances of stock by Coca-Cola Amatil in connection with the acquisition of SPC Ardmona Pty. Ltd., an Australian fruit company. Refer to Note 4. |
Geographic Data (in millions)
| Year Ended December 31, | 2007 | 2006 | 2005 | ||||||
| Net operating revenues: |
|||||||||
| United States |
$ | 7,556 | $ | 6,662 | $ | 6,299 | |||
| International |
21,301 | 17,426 | 16,805 | ||||||
| Net operating revenues |
$ | 28,857 | $ | 24,088 | $ | 23,104 | |||
| December 31, | 2007 | 2006 | 2005 | ||||||
| Property, plant and equipmentnet: |
|||||||||
| United States |
$ | 2,750 | $ | 2,607 | $ | 2,309 | |||
| International |
5,743 | 4,296 | 3,522 | ||||||
| Property, plant and equipmentnet |
$ | 8,493 | $ | 6,903 | $ | 5,831 | |||
NOTE 22: SUBSEQUENT EVENT
On February 5, 2008, the Company and Honest Tea, Inc. completed an agreement resulting in the Company holding an approximate 40 percent interest in Honest Tea, Inc., the maker of organic beverages, including beverages sold under the Honest Tea trademark. The Company also may elect to buy, and the remaining Honest Tea, Inc. shareholders may elect to sell to the Company, the outstanding interest not currently owned by the Company.
127
Table of Contents
REPORT OF MANAGEMENT ON INTERNAL CONTROL OVER FINANCIAL REPORTING
The Coca-Cola Company and Subsidiaries
Management of the Company is responsible for the preparation and integrity of the consolidated financial statements appearing in our annual report on Form 10-K. The financial statements were prepared in conformity with generally accepted accounting principles appropriate in the circumstances and, accordingly, include certain amounts based on our best judgments and estimates. Financial information in this annual report on Form 10-K is consistent with that in the financial statements.
Management of the Company is responsible for establishing and maintaining adequate internal control over financial reporting as such term is defined in Rules 13a-15(f) under the Securities Exchange Act of 1934 (Exchange Act). The Companys internal control over financial reporting is designed to provide reasonable assurance regarding the reliability of financial reporting and the preparation of the consolidated financial statements. Our internal control over financial reporting is supported by a program of internal audits and appropriate reviews by management, written policies and guidelines, careful selection and training of qualified personnel and a written Code of Business Conduct adopted by our Companys Board of Directors, applicable to all Company Directors and all officers and employees of our Company and subsidiaries.
Because of its inherent limitations, internal control over financial reporting may not prevent or detect misstatements and even when determined to be effective, can only provide reasonable assurance with respect to financial statement preparation and presentation. Also, projections of any evaluation of effectiveness to future periods are subject to the risk that controls may become inadequate because of changes in conditions, or that the degree of compliance with the policies or procedures may deteriorate.
The Audit Committee of our Companys Board of Directors, composed solely of Directors who are independent in accordance with the requirements of the New York Stock Exchange listing standards, the Exchange Act and the Companys Corporate Governance Guidelines, meets with the independent auditors, management and internal auditors periodically to discuss internal control over financial reporting and auditing and financial reporting matters. The Audit Committee reviews with the independent auditors the scope and results of the audit effort. The Audit Committee also meets periodically with the independent auditors and the chief internal auditor without management present to ensure that the independent auditors and the chief internal auditor have free access to the Audit Committee. Our Audit Committees Report can be found in the Companys 2008 Proxy Statement.
Management assessed the effectiveness of the Companys internal control over financial reporting as of December 31, 2007. In making this assessment, management used the criteria set forth by the Committee of Sponsoring Organizations of the Treadway Commission (COSO) in Internal ControlIntegrated Framework. During 2007, the Company acquired the 65 percent interest in Coca-Cola Bottlers Philippines, Inc. which it did not already own and 18 bottling and distribution operations in Germany. Refer to Note 20 of Notes to Consolidated Financial Statements for additional information regarding these events. In accordance with SEC Staff guidance, management has excluded these businesses from its evaluation of the effectiveness of the Companys internal control over financial reporting as of December 31, 2007. The net operating revenues attributable to these businesses represented approximately 3.5 percent of the Companys consolidated net operating revenues for the year ended December 31, 2007, and their aggregate total assets represented approximately 5.0 percent of the Companys consolidated total assets as of December 31, 2007. Based on our assessment, management believes that the Company maintained effective internal control over financial reporting as of December 31, 2007.
The Companys independent auditors, Ernst & Young LLP, a registered public accounting firm, are appointed by the Audit Committee of the Companys Board of Directors, subject to ratification by our Companys shareowners. Ernst & Young LLP has audited and reported on the consolidated financial statements of The Coca-Cola Company and subsidiaries and the Companys internal control over financial reporting. The reports of the independent auditors are contained in this annual report.
|
|
|
|
| E. Neville Isdell | Harry L. Anderson | |
| Chairman, Board of Directors, and Chief Executive Officer February 27, 2008 |
Vice President and Controller February 27, 2008 |
|
|
|
||
| Gary P. Fayard | ||
| Executive Vice President and Chief Financial Officer February 27, 2008 |
||


128
Table of Contents
Report of Independent Registered Public Accounting Firm
Board of Directors and Shareowners
The Coca-Cola Company
We have audited the accompanying consolidated balance sheets of The Coca-Cola Company and subsidiaries as of December 31, 2007 and 2006, and the related consolidated statements of income, shareowners equity, and cash flows for each of the three years in the period ended December 31, 2007. These financial statements are the responsibility of the Companys management. Our responsibility is to express an opinion on these financial statements based on our audits.
We conducted our audits in accordance with the standards of the Public Company Accounting Oversight Board (United States). Those standards require that we plan and perform the audit to obtain reasonable assurance about whether the financial statements are free of material misstatement. An audit includes examining, on a test basis, evidence supporting the amounts and disclosures in the financial statements. An audit also includes assessing the accounting principles used and significant estimates made by management, as well as evaluating the overall financial statement presentation. We believe that our audits provide a reasonable basis for our opinion.
In our opinion, the financial statements referred to above present fairly, in all material respects, the consolidated financial position of The Coca-Cola Company and subsidiaries at December 31, 2007 and 2006, and the consolidated results of their operations and their cash flows for each of the three years in the period ended December 31, 2007, in conformity with U.S. generally accepted accounting principles.
As discussed in Notes 1 and 17 to the consolidated financial statements, in 2007 the Company adopted FASB Interpretation No. 48 related to accounting for uncertainty in income taxes. Also as discussed in Note 1 to the consolidated financial statements, in 2006 the Company adopted SFAS No. 158 related to defined benefit pension and other postretirement plans.
We also have audited, in accordance with the standards of the Public Company Accounting Oversight Board (United States), The Coca-Cola Companys internal control over financial reporting as of December 31, 2007, based on criteria established in Internal ControlIntegrated Framework issued by the Committee of Sponsoring Organizations of the Treadway Commission and our report dated February 27, 2008, expressed an unqualified opinion thereon.

Atlanta, Georgia
February 27, 2008
129
Table of Contents
Report of Independent Registered Public Accounting Firm on Internal Control Over Financial Reporting
Board of Directors and Shareowners
The Coca-Cola Company
We have audited The Coca-Cola Companys internal control over financial reporting as of December 31, 2007, based on criteria established in Internal ControlIntegrated Framework issued by the Committee of Sponsoring Organizations of the Treadway Commission (the COSO criteria). The Coca-Cola Companys management is responsible for maintaining effective internal control over financial reporting, and for its assessment of the effectiveness of internal control over financial reporting included in the accompanying Report of Management on Internal Control Over Financial Reporting. Our responsibility is to express an opinion on the Companys internal control over financial reporting based on our audit.
We conducted our audit in accordance with the standards of the Public Company Accounting Oversight Board (United States). Those standards require that we plan and perform the audit to obtain reasonable assurance about whether effective internal control over financial reporting was maintained in all material respects. Our audit included obtaining an understanding of internal control over financial reporting, assessing the risk that a material weakness exists, testing and evaluating the design and operating effectiveness of internal control based on the assessed risk, and performing such other procedures as we considered necessary in the circumstances. We believe that our audit provides a reasonable basis for our opinion.
A companys internal control over financial reporting is a process designed to provide reasonable assurance regarding the reliability of financial reporting and the preparation of financial statements for external purposes in accordance with generally accepted accounting principles. A companys internal control over financial reporting includes those policies and procedures that (1) pertain to the maintenance of records that, in reasonable detail, accurately and fairly reflect the transactions and dispositions of the assets of the company; (2) provide reasonable assurance that transactions are recorded as necessary to permit preparation of financial statements in accordance with generally accepted accounting principles, and that receipts and expenditures of the company are being made only in accordance with authorizations of management and directors of the company; and (3) provide reasonable assurance regarding prevention or timely detection of unauthorized acquisition, use, or disposition of the companys assets that could have a material effect on the financial statements.
Because of its inherent limitations, internal control over financial reporting may not prevent or detect misstatements. Also, projections of any evaluation of effectiveness to future periods are subject to the risk that controls may become inadequate because of changes in conditions, or that the degree of compliance with the policies or procedures may deteriorate.
As indicated in the accompanying Report of Management on Internal Control Over Financial Reporting, managements assessment of and conclusion on the effectiveness of internal control over financial reporting did not include the internal controls of Coca-Cola Bottlers Philippines, Inc. (CCBPI) and 18 bottling and distribution operations in Germany, which are included in the 2007 consolidated financial statements of The Coca-Cola Company and subsidiaries and constituted approximately 5.0 percent of the Companys consolidated total assets as of December 31, 2007 and approximately 3.5 percent of the Companys consolidated net operating revenues for the year then ended. Our audit of internal control over financial reporting of The Coca-Cola Company also did not include an evaluation of the internal control over financial reporting of CCBPI and the 18 bottling and distribution operations in Germany.
In our opinion, The Coca-Cola Company maintained, in all material respects, effective internal control over financial reporting as of December 31, 2007, based on the COSO criteria.
We also have audited, in accordance with the standards of the Public Company Accounting Oversight Board (United States), the consolidated balance sheets of The Coca-Cola Company and subsidiaries as of December 31, 2007 and 2006, and the related consolidated statements of income, shareowners equity, and cash flows for each of the three years in the period ended December 31, 2007, and our report dated February 27, 2008, expressed an unqualified opinion thereon.
Atlanta, Georgia
February 27, 2008
130
Table of Contents
| Year Ended December 31, | First Quarter |
Second Quarter |
Third Quarter |
Fourth Quarter |
Full Year | ||||||||||
| (In millions except per share data) | |||||||||||||||
| 2007 |
|||||||||||||||
| Net operating revenues |
$ | 6,103 | $ | 7,733 | $ | 7,690 | $ | 7,331 | $ | 28,857 | |||||
| Gross profit |
3,958 | 4,997 | 4,806 | 4,690 | 18,451 | ||||||||||
| Net income |
1,262 | 1,851 | 1,654 | 1,214 | 5,981 | ||||||||||
| Basic net income per share |
$ | 0.55 | $ | 0.80 | $ | 0.72 | $ | 0.52 | $ | 2.59 | |||||
| Diluted net income per share |
$ | 0.54 | $ | 0.80 | $ | 0.71 | $ | 0.52 | $ | 2.57 | |||||
| 2006 |
|||||||||||||||
| Net operating revenues |
$ | 5,226 | $ | 6,476 | $ | 6,454 | $ | 5,932 | $ | 24,088 | |||||
| Gross profit |
3,500 | 4,366 | 4,189 | 3,869 | 15,924 | ||||||||||
| Net income |
1,106 | 1,836 | 1,460 | 678 | 5,080 | ||||||||||
| Basic net income per share |
$ | 0.47 | $ | 0.78 | $ | 0.62 | $ | 0.29 | $ | 2.16 | |||||
| Diluted net income per share |
$ | 0.47 | $ | 0.78 | $ | 0.62 | $ | 0.29 | $ | 2.16 | |||||
Our reporting period ends on the Friday closest to the last day of the quarterly calendar period. Our fiscal year ends on December 31 regardless of the day of the week on which December 31 falls.
The Companys first quarter of 2007 results were impacted by one less shipping day as compared to the first quarter of 2006. Additionally, the Company recorded the following transactions which impacted results:
| | Approximately $10 million of charges primarily related to restructuring and asset write-downs in Africa, Bottling Investments and Corporate. Refer to Note 18 and Note 19. |
| | An approximate $73 million charge to equity incomenet primarily related to our proportionate share of asset write-downs by CCBPI. Refer to Note 19. |
| | An approximate $137 million net gain primarily due to the sale of real estate in Spain and the sale of substantially all of our ownership interest in Vonpar. Refer to Note 19. |
| | Approximately $73 million of tax expense related to the gains on the sale of our ownership interest in Vonpar and the sale of real estate in Spain, as mentioned above. Refer to Note 17. |
| | An approximate $11 million tax expense related to amounts required to be recorded for changes to our uncertain tax positions under Interpretation No. 48, including interest and penalties. Refer to Note 17. |
In the second quarter of 2007, the Company recorded the following transactions which impacted results:
| | Approximately $48 million of charges primarily related to restructuring and asset write-downs in Africa, European Union, Latin America, the Pacific, Bottling Investments and Corporate. Refer to Note 18 and Note 19. |
| | An approximate $89 million charge to equity incomenet primarily related to our proportionate share of an impairment recorded on investments by Coca-Cola Amatil in bottling operations in South Korea, along with our proportionate share of an asset write-down recorded by CCBPI and our proportionate share of restructuring charges recorded by CCE. Refer to Note 3 and Note 19. |
| | An approximate $38 million tax benefit related to restructuring and asset write-downs and our proportionate share of charges recorded by equity investees, as mentioned above. Refer to Note 17. |
| | An approximate $30 million tax expense related to amounts required to be recorded for changes to our uncertain tax positions under Interpretation No. 48. Refer to Note 17. |
131
Table of Contents
In the third quarter of 2007, the Company recorded the following transactions which impacted results:
| | Approximately $84 million of charges primarily related to restructuring activities and asset write-downs in Africa, Eurasia, European Union, Latin America, North America, Bottling Investments and Corporate. Refer to Note 18 and Note 19. |
| | An approximate $73 million net gain related to the sale of a portion of our ownership interest in Coca-Cola Amatil. Refer to Note 3 and Note 19. |
| | An approximate $21 million increase to equity incomenet primarily related to our proportionate share of tax benefits recorded at CCE, partially offset by asset write-downs and restructuring costs recorded by CCBPI. Refer to Note 3 and Note 19. |
| | An approximate $15 million tax expense related to amounts required to be recorded for changes to our uncertain tax positions under Interpretation No. 48. Refer to Note 17. |
| | A tax charge of approximately $31 million primarily related to the gain on the sale of a portion of our ownership interest in Coca-Cola Amatil, as mentioned above. Refer to Note 17. |
| | An approximate $19 million tax benefit related to tax rate changes in Germany. Refer to Note 17. |
The Companys fourth quarter of 2007 results were impacted by one additional shipping day as compared to the fourth quarter of 2006. Additionally, the Company recorded the following transactions which impacted results:
| | Approximately $126 million of charges primarily related to asset write-downs and restructuring activities in Africa, Eurasia, the European Union, Latin America, North America, the Pacific, Bottling Investments and Corporate. Refer to Note 18 and Note 19. |
| | An approximate $18 million gain related to the sale of real estate in the United States. Refer to Note 19. |
| | An approximate $9 million charge to equity incomenet primarily due to our proportionate share of asset write-downs and restructuring costs recorded at various equity method investees, offset by tax benefits recorded by CCE. Refer to Note 3 and Note 19. |
| | An approximate $40 million tax expense related to amounts required to be recorded for changes to our uncertain tax positions under Interpretation No. 48. Refer to Note 17. |
| | An income tax benefit of approximately $19 million primarily related to asset write-downs and restructuring activities in Africa, Eurasia, the European Union, Latin America, North America, the Pacific, Bottling Investments and Corporate. Refer to Note 17. |
The Companys first quarter of 2006 results were impacted by one less shipping day as compared to the first quarter of 2005. Additionally, the Company recorded the following transactions which impacted results:
| | Impairment charges totaling approximately $42 million primarily related to the impairment of certain assets and investments in certain bottling operations in Asia. Refer to Note 19. |
| | Approximately $3 million of charges primarily related to restructuring in the Pacific. Refer to Note 19. |
| | An approximate $9 million charge to equity income for our proportionate share of CCEs restructuring costs. Refer to Note 3. |
| | An income tax benefit of approximately $7 million primarily related to asset impairment and restructuring charges in Asia. Refer to Note 17. |
| | Approximately $10 million of income tax expense primarily related to increases in tax reserves. Refer to Note 17. |
In the second quarter of 2006, the Company recorded the following transactions which impacted results:
| | An approximate $123 million net gain related to the sale of a portion of our investment in Coca-Cola Icecek in an initial public offering. This gain was recorded in the line item other income (loss)net. Refer to Note 19. |
132
Table of Contents
| | Charges totaling approximately $31 million primarily related to costs associated with production capacity efficiencies and other restructuring costs in Asia and the European Union. Refer to Note 19. |
| | An approximate $21 million benefit to equity income for our proportionate share of favorable changes in certain of CCEs state and Canadian federal and provincial tax rates. Refer to Note 3 and Note 19. |
| | Approximately $22 million of income tax expense related to the anticipated future resolution of certain tax matters. Refer to Note 17. |
| | An income tax benefit of approximately $14 million related to the sale of a portion of our investment in Coca-Cola Icecek. Refer to Note 17. |
In the third quarter of 2006, the Company recorded the following transactions which impacted results:
| | Approximately $39 million of charges primarily related to the impairment of certain intangible assets and investments in certain bottling operations, costs to rationalize production and other restructuring costs in Africa, the European Union and Asia. Refer to Note 19. |
| | An approximate $3 million charge to equity incomenet for our proportionate share of items impacting investees. Refer to Note 3 and Note 19. |
| | An income tax benefit of approximately $41 million related to the reversal of a tax valuation allowance due to the sale of a portion of our equity method investment in Coca-Cola FEMSA, partially offset by a charge for the anticipated future resolution of certain tax matters and a change in the tax rate applicable to a portion of the temporary difference between the book and tax basis of our investment in Coca-Cola FEMSA. Refer to Note 3 and Note 19. |
| | An income tax benefit of approximately $12 million associated with impairment charges, costs to rationalize production and other restructuring costs. Refer to Note 17. |
The Companys fourth quarter of 2006 results were impacted by one additional shipping day as compared to the fourth quarter of 2005. Additionally, the Company recorded the following transactions which impacted results:
| | An approximate $615 million charge to equity income related to the Companys proportionate share of CCEs impairment charges and restructuring charges recorded by other equity method investees, partially offset by changes in certain of CCEs state and Canadian federal and provincial tax rates. Refer to Note 3 and Note 19. |
| | Approximately $74 million of charges primarily related to restructuring and asset impairments in the Pacific and certain bottling operations. Refer to Note 19. |
| | A $100 million donation made to The Coca-Cola Foundation. Refer to Note 19. |
| | An approximate $175 million net gain related to the sale of Coca-Cola FEMSA shares. This gain was recorded in the line item other income (loss)net. Refer to Note 19. |
| | An income tax benefit of approximately $10 million associated with restructuring costs and impairment charges. Refer to Note 17. |
| | An income tax benefit of approximately $38 million associated with a donation made to The Coca-Cola Foundation. Refer to Note 17. |
| | An income tax benefit of approximately $37 million related to the reversal of previously accrued taxes resulting from the anticipated future resolution of certain tax matters. Refer to Note 17. |
| | An income tax benefit of approximately $57 million associated with items impacting investees. Refer to Note 17. |
| | Approximately $76 million of income tax expense associated with the gain on the sale of Coca-Cola FEMSA shares. Refer to Note 17. |
133
Table of Contents
| ITEM 9. | CHANGES IN AND DISAGREEMENTS WITH ACCOUNTANTS ON ACCOUNTING AND FINANCIAL DISCLOSURE |
Not applicable.
ITEM 9A. CONTROLS AND PROCEDURES
The Company, under the supervision and with the participation of its management, including the Chief Executive Officer and the Chief Financial Officer, evaluated the effectiveness of the design and operation of the Companys disclosure controls and procedures (as defined in Rule 13a-15(e) under the Securities Exchange Act of 1934, as amended (the Exchange Act)) as of the end of the period covered by this report. Based on that evaluation, the Chief Executive Officer and the Chief Financial Officer concluded that the Companys disclosure controls and procedures were effective as of December 31, 2007.
The report called for by Item 308(a) of Regulation S-K is incorporated by reference to Report of Management on Internal Control Over Financial Reporting, included in Part II, Item 8. Financial Statements and Supplementary Data of this report. During 2007, the Company acquired the 65 percent interest in Coca-Cola Bottlers Philippines, Inc. which it did not already own and 18 bottling and distribution operations in Germany. Refer to Note 20 of Notes to Consolidated Financial Statements for additional information regarding these events. Management has excluded these businesses from its evaluation of the effectiveness of the Companys internal control over financial reporting as of December 31, 2007. The net revenues attributable to these businesses represented approximately 3.5 percent of the Companys consolidated net operating revenues for the year ended December 31, 2007, and their aggregate total assets represented approximately 5.0 percent of the Companys consolidated total assets as of December 31, 2007.
The report called for by Item 308(b) of Regulation S-K is incorporated by reference to Report of Independent Registered Public Accounting Firm on Internal Control Over Financial Reporting, included in Part II, Item 8. Financial Statements and Supplementary Data of this report.
There has been no change in the Companys internal control over financial reporting during the quarter ended December 31, 2007 that has materially affected, or is reasonably likely to materially affect, the Companys internal control over financial reporting.
Not applicable.
134
Table of Contents
| ITEM 10. | DIRECTORS, EXECUTIVE OFFICERS AND CORPORATE GOVERNANCE |
The information under the headings Board of Directors, Section 16(a) Beneficial Ownership Reporting Compliance, Information About the Board of Directors and Corporate GovernanceThe Audit Committee and Information About the Board of Directors and Corporate GovernanceThe Board and Board Committees in the Companys 2008 Proxy Statement is incorporated herein by reference. See Item X in Part I of this report for information regarding executive officers of the Company.
The Company has adopted a code of business conduct and ethics applicable to the Companys officers (including the Companys principal executive officer, principal financial officer and controller) and employees, known as the Code of Business Conduct. In addition, the Company has adopted a Code of Business Conduct for Non-Employee Directors. Both Codes of Business Conduct are available on the Companys website. In the event that we amend or waive any of the provisions of the Code of Business Conduct applicable to our principal executive officer, principal financial officer or controller that relates to any element of the code of ethics definition enumerated in Item 406(b) of Regulation S-K, we intend to disclose the same on the Companys website at www.thecoca-colacompany.com.
On May 11, 2007, we filed with the New York Stock Exchange (NYSE) the Annual CEO Certification regarding the Companys compliance with the NYSEs corporate governance listing standards as required by Section 303A-12(a) of the NYSE Listed Company Manual. In addition, the Company has filed as exhibits to this annual report and to the annual report on Form 10-K for the fiscal year ended December 31, 2006, the applicable certifications of its Chief Executive Officer and its Chief Financial Officer required under Section 302 of the Sarbanes-Oxley Act of 2002, regarding the quality of the Companys public disclosures.
| ITEM 11. | EXECUTIVE COMPENSATION |
The information under the principal headings DIRECTOR COMPENSATION, COMPENSATION DISCUSSION AND ANALYSIS, EXECUTIVE COMPENSATION, REPORT OF THE COMPENSATION COMMITTEE, and COMPENSATION COMMITTEE INTERLOCKS AND INSIDER PARTICIPATION in the Companys 2008 Proxy Statement is incorporated herein by reference.
| ITEM 12. | SECURITY OWNERSHIP OF CERTAIN BENEFICIAL OWNERS AND MANAGEMENT AND RELATED STOCKHOLDER MATTERS |
The information under the principal heading EQUITY COMPENSATION PLAN INFORMATION, and the information under the headings Ownership of Equity Securities of the Company and Principal Shareowners in the Companys 2008 Proxy Statement is incorporated herein by reference.
| ITEM 13. | CERTAIN RELATIONSHIPS AND RELATED TRANSACTIONS, AND DIRECTOR INDEPENDENCE |
The information under the headings Information About the Board of Directors and Corporate GovernanceIndependence Determinations and Certain Related Person Transactions and the information under the principal headings COMPENSATION COMMITTEE INTERLOCKS AND INSIDER PARTICIPATION, and COCA-COLA ENTERPRISES INC. in the Companys 2008 Proxy Statement is incorporated herein by reference.
ITEM 14. PRINCIPAL ACCOUNTANT FEES AND SERVICES
The information under the headings Audit Fees and All Other Fees and Audit Committee Pre-Approval of Audit and Permissible Non-Audit Services of Independent Auditors in the Companys 2008 Proxy Statement is incorporated herein by reference.
135
Table of Contents
| ITEM 15. | EXHIBITS AND FINANCIAL STATEMENT SCHEDULES |
| (a) | The following documents are filed as part of this report: |
| 1. | Financial Statements: |
Consolidated Statements of IncomeYears ended December 31, 2007, 2006 and 2005.
Consolidated Balance SheetsDecember 31, 2007 and 2006.
Consolidated Statements of Cash FlowsYears ended December 31, 2007, 2006 and 2005.
Consolidated Statements of Shareowners EquityYears ended December 31, 2007, 2006 and 2005.
Notes to Consolidated Financial Statements.
Report of Independent Registered Public Accounting Firm.
Report of Independent Registered Public Accounting Firm on Internal Control Over Financial Reporting.
| 2. | Financial Statement Schedules: |
The schedules for which provision is made in the applicable accounting regulations of the SEC are not required under the related instructions or are inapplicable and, therefore, have been omitted.
| 3. | Exhibits |
136
Table of Contents
| Exhibit No. |
||
| 2.1 | Control and Profit and Loss Transfer Agreement, dated November 21, 2001, between Coca-Cola GmbH and Coca-Cola Erfrischungsgetraenke AGincorporated herein by reference to Exhibit 2 of the Companys Form 10-Q Quarterly Report for the quarter ended March 31, 2002. (With regard to applicable cross-references in this report, the Companys Current, Quarterly and Annual Reports are filed with the SEC under File No. 1-2217.) | |
| 2.2 | Agreement and Plan of Merger by and among The Coca-Cola Company, Mustang Acquisition Company, LLP, Energy Brands Inc. d/b/a Glaceau, and the Stockholder Representatives identified therein, dated as of May 24, 2007incorporated herein by reference to Exhibit 2.1 to the Companys Current Report on Form 8-K filed May 31, 2007. In accordance with Item 601(b)(2) of Regulation S-X, the disclosure schedules to the Agreement and Plan of Merger were not filed. The Agreement and Plan of Merger contains a list briefly identifying the contents of all omitted disclosure schedules and the Company hereby agrees to furnish supplementally a copy of any omitted disclosure schedule to the Securities and Exchange Commission upon request. | |
| 3.1 | Certificate of Incorporation of the Company, including Amendment of Certificate of Incorporation, effective May 1, 1996incorporated herein by reference to Exhibit 3 of the Companys Form 10-Q Quarterly Report for the quarter ended March 31, 1996. | |
| 3.2 | By-Laws of the Company, as amended and restated through October 19, 2006incorporated herein by reference to Exhibit 99.1 of the Companys Form 8-K Current Report, filed October 20, 2006. | |
| 4.1 | The Company agrees to furnish to the Securities and Exchange Commission, upon request, a copy of any instrument defining the rights of holders of long-term debt of the Company and all of its consolidated subsidiaries and unconsolidated subsidiaries for which financial statements are required to be filed with the SEC. | |
| 4.2 | Form of Note for 5.350% Notes due November 15, 2017incorporated herein by reference to Exhibit 4.1 to the Companys Current Report on Form 8-K filed October 31, 2007 | |
| 10.1 | Supplemental Disability Plan of the Company, as amended and restated effective January 1, 2003incorporated herein by reference to Exhibit 10.2 of the Companys Form 10-K Annual Report for the year ended December 31, 2002.* | |
| 10.2 | Performance Incentive Plan of the Company, as amended and restated December 13, 2006incorporated herein by reference to Exhibit 10.3 to the Companys Annual Report on Form 10-K for the year ended December 31, 2006.* | |
| 10.3 | 1991 Stock Option Plan of the Company, as amended and restated through December 13, 2006incorporated herein by reference to Exhibit 10.4 to the Companys Annual Report on Form 10-K for the year ended December 31, 2006.* | |
| 10.4.1 | 1999 Stock Option Plan of the Company, as amended and restated through December 1, 2007incorporated herein by reference to Exhibit 10.2 to the Companys Form 8-K Current Report, filed February 21, 2008.* | |
| 10.4.2 | Form of Stock Option Agreement in connection with the 1999 Stock Option Plan of the Companyincorporated herein by reference to Exhibit 99.1 of the Companys Form 8-K Current Report filed February 14, 2007.* | |
| 10.4.3 | Form of Stock Option Agreement for E. Neville Isdell in connection with the 1999 Stock Option Plan of the Companyincorporated herein by reference to Exhibit 99.2 of the Companys Form 8-K Current Report filed February 14, 2007.* | |
137
Table of Contents
| Exhibit No. |
||
| 10.4.4 | Form of Stock Option Agreement for E. Neville Isdell in connection with the 1999 Stock Option Plan of the Company, as adopted December 12, 2007incorporated herein by reference to Exhibit 10.7 of the Companys Form 8-K Current Report filed February 21 2008.* | |
| 10.4.5 | Form of Stock Option Agreement in connection with the 1999 Stock Option Plan of the Company, as adopted December 12, 2007incorporated herein by reference to Exhibit 10.8 of the Companys Form 8-K Current Report filed February 21 2008.* | |
| 10.5.1 | 2002 Stock Option Plan of the Company, as amended and restated through December 1, 2007incorporated herein by reference to Exhibit 10.3 to the Companys Form 8-K Current Report, filed February 21, 2008.* | |
| 10.5.2 | Form of Stock Option Agreement in connection with the 2002 Stock Option Plan, as amendedincorporated herein by reference to Exhibit 99.1 of the Companys Form 8-K Current Report filed on December 8, 2004.* | |
| 10.5.3 | Form of Stock Option Agreement for E. Neville Isdell in connection with the 2002 Stock Option Plan, as amendedincorporated herein by reference to Exhibit 99.1 of the Companys Form 8-K Current Report filed February 23, 2005.* | |
| 10.5.4 | Form of Stock Option Agreement in connection with the 2002 Stock Option Plan, as adopted December 12, 2007incorporated herein by reference to 10.9 of the Companys Form 8-K Current Report filed on February 21, 2008.* | |
| 10.6 | 1983 Restricted Stock Award Plan of the Company, as amended through December 1, 2007.* | |
| 10.7.1 | 1989 Restricted Stock Award Plan of the Company, as amended through February 20, 2008incorporated herein by reference to Exhibit 10.1 to the Companys Form 8-K Current Report, filed February 21, 2008.* | |
| 10.7.2 | Form of Restricted Stock Agreement (Performance Share Unit Agreement) in connection with the 1989 Restricted Stock Award Plan of the Companyincorporated herein by reference to Exhibit 10.1 of the Companys Form 8-K Current Report filed April 19, 2005.* | |
| 10.7.3 | Form of Restricted Stock Agreement (Performance Share Unit Agreement) in connection with the 1989 Restricted Stock Award Plan of the Company, effective as of December 2005incorporated herein by reference to Exhibit 99.1 of the Companys Form 8-K Current Report filed December 14, 2005.* | |
| 10.7.4 | Form of Restricted Stock Agreement (Performance Share Unit Agreement) for E. Neville Isdell in connection with the 1989 Restricted Stock Award Plan of the Company, as amendedincorporated herein by reference to Exhibit 99.2 of the Companys Form 8-K Current Report filed on February 23, 2005.* | |
| 10.7.5 | Form of Restricted Stock Agreement (Performance Share Unit Agreement) in connection with the 1989 Restricted Stock Award Plan of the Companyincorporated herein by reference to Exhibit 99.2 of the Companys Form 8-K Current Report filed on February 15, 2006.* | |
| 10.7.6 | Form of Restricted Stock Agreement (Performance Share Unit Agreement) for E. Neville Isdell in connection with the 1989 Restricted Stock Award Plan of the Companyincorporated herein by reference to Exhibit 99.1 of the Companys Form 8-K Current Report filed on February 17, 2006.* | |
| 10.7.7 | Form of Restricted Stock Agreement (Performance Share Unit Agreement) in connection with the 1989 Restricted Stock Award Plan of the Companyincorporated herein by reference to Exhibit 99.3 of the Companys Form 8-K Current Report filed February 14, 2007.* | |
138
Table of Contents
| Exhibit No. |
||
| 10.7.8 | Form of Restricted Stock Agreement (Performance Share Unit Agreement) for E. Neville Isdell in connection with the 1989 Restricted Stock Award Plan of the Company, as adopted December 12, 2007incorporated herein by reference to Exhibit 10.4 of the Companys Form 8-K Current Report filed February 21, 2008.* | |
| 10.7.9 | Form of Restricted Stock Agreement (Performance Share Unit Agreement) in connection with the 1989 Restricted Stock Award Plan of the Company, as adopted December 12, 2007incorporated herein by reference to Exhibit 10.5 of the Companys Form 8-K Current Report filed February 21, 2008.* | |
| 10.7.10 | Form of Restricted Stock Agreement (Performance Share Unit Agreement) for France in connection with the 1989 Restricted Stock Award Plan of the Company, as adopted December 12, 2007incorporated herein by reference to Exhibit 10.6 of the Companys Form 8-K Current Report filed February 21, 2008.* | |
| 10.8.1 | Compensation Deferral & Investment Program of the Company, as amended, including Amendment Number Four dated November 28, 1995incorporated herein by reference to Exhibit 10.13 of the Companys Form 10-K Annual Report for the year ended December 31, 1995.* | |
| 10.8.2 | Amendment Number Five to the Compensation Deferral & Investment Program of the Company, effective as of January 1, 1998incorporated herein by reference to Exhibit 10.8.2 of the Companys Form 10-K Annual Report for the year ended December 31, 1997.* | |
| 10.8.3 | Amendment Number Six to the Compensation Deferral & Investment Program of the Company, dated as of January 12, 2004, effective January 1, 2004incorporated herein by reference to Exhibit 10.9.3 of the Companys Form 10-K Annual Report for the year ended December 31, 2003.* | |
| 10.9.1 | Executive Medical Plan of the Company, as amended and restated effective January 1, 2001incorporated herein by reference to Exhibit 10.10 of the Companys Form 10-K Annual Report for the year ended December 31, 2002.* | |
| 10.9.2 | Amendment Number One to the Executive Medical Plan of the Company, dated April 15, 2003incorporated herein by reference to Exhibit 10.1 of the Companys Form 10-Q Quarterly Report for the quarter ended June 30, 2003.* | |
| 10.9.3 | Amendment Number Two to the Executive Medical Plan of the Company, dated August 27, 2003incorporated herein by reference to Exhibit 10 of the Companys Form 10-Q Quarterly Report for the quarter ended September 30, 2003.* | |
| 10.9.4 | Amendment Number Three to the Executive Medical Plan of the Company, dated December 29, 2004, effective January 1, 2005incorporated herein by reference to Exhibit 10.10.4 of the Companys Form 10-K Annual Report for the year ended December 31, 2004.* | |
| 10.9.5 | Amendment Number Four to the Executive Medical Plan of the Companyincorporated herein by reference to Exhibit 10.6 of the Companys Form 10-Q Quarterly Report for the quarter ended July 1, 2005.* | |
| 10.9.6 | Amendment Number Five to the Executive Medical Plan of the Company, dated December 20, 2005incorporated herein by reference to Exhibit 10.10.6 of the Companys Form 10-K Annual Report for the year ended December 31, 2005.* | |
| 10.10.1 | Supplemental Benefit Plan of the Company, as amended and restated effective January 1, 2002incorporated herein by reference to Exhibit 10.11 of the Companys Form 10-K Annual Report for the year ended December 31, 2002.* | |
| 10.10.2 | Amendment One to the Supplemental Benefit Plan of the Company, dated as of February 27, 2003incorporated herein by reference to Exhibit 10.5 of the Companys Form 10-Q Quarterly Report for the quarter ended March 31, 2003.* | |
139
Table of Contents
| Exhibit No. |
||
| 10.10.3 | Amendment Two to the Supplemental Benefit Plan of the Company, dated as of November 14, 2003, effective October 21, 2003incorporated herein by reference to Exhibit 10.11.3 of the Companys Form 10-K Annual Report for the year ended December 31, 2003.* | |
| 10.10.4 | Amendment Three to the Supplemental Benefit Plan of the Company, dated April 14, 2004, effective as of January 1, 2004incorporated herein by reference to Exhibit 10.3 of the Companys Form 10-Q Quarterly Report for the quarter ended March 31, 2004.* | |
| 10.10.5 | Amendment Four to the Supplemental Benefit Plan of the Company, dated December 15, 2004, effective January 1, 2005incorporated herein by reference to Exhibit 10.11.5 of the Companys Form 10-K Annual Report for the year ended December 31, 2004.* | |
| 10.10.6 | Amendment Five to the Supplemental Benefit Plan of the Company, dated December 21, 2005incorporated herein by reference to Exhibit 10.11.6 of the Companys Form 10-K Annual Report for the year ended December 31, 2005.* | |
| 10.10.7 | Amendment Six to the Supplemental Benefit Plan of the Company, dated July 18, 2006incorporated herein by reference to Exhibit 10.3 of the Companys Form 10-Q Quarterly Report for the quarter ended June 30, 2006.* | |
| 10.11 | The Coca-Cola Company Deferred Compensation Plan for Non-Employee Directors, as amended and restated effective April 1, 2006incorporated herein by reference to Exhibit 99.2 of the Companys Form 8-K Current Report filed April 5, 2006.* | |
| 10.12 | Compensation Plan for Non-Employee Directors of The Coca-Cola Company, as amended and restated on December 13, 2007incorporated herein by reference to Exhibit 99.1 of the Companys Form 8-K Current Report filed on December 19, 2007. | |
| 10.13 | Long-Term Performance Incentive Plan of the Company, as amended and restated effective December 13, 2006.* | |
| 10.14 | Executive Incentive Plan of the Company, adopted as of February 14, 2001incorporated herein by reference to Exhibit 10.19 of the Companys Form 10-K Annual Report for the year ended December 31, 2000.* | |
| 10.15 | Form of United States Master Bottler Contract between the Company and Coca-Cola Enterprises Inc. (Coca-Cola Enterprises) or its subsidiariesincorporated herein by reference to Exhibit 10.24 of Coca-Cola Enterprises Annual Report on Form 10-K for the fiscal year ended December 30, 1988 (File No. 01-09300). | |
| 10.16.1 | Deferred Compensation Plan of the Company, as amended and restated December 17, 2003incorporated herein by reference to Exhibit 10.26.1 of the Companys Form 10-K Annual Report for the year ended December 31, 2003.* | |
| 10.16.2 | Deferred Compensation Plan Delegation of Authority from the Compensation Committee to the Management Committee, adopted as of December 17, 2003incorporated herein by reference to Exhibit 10.26.2 of the Companys Form 10-K Annual Report for the year ended December 31, 2003.* | |
| 10.16.3 | Amendment One to the Deferred Compensation Plan of the Company, as amended and restated effective December 17, 2003incorporated herein by reference to Exhibit 10.24.3 of the Companys Form 10-K Annual Report for the year ended December 31, 2005.* | |
| 10.17 | The Coca-Cola Export Corporation Employee Share Plan, effective as of March 13, 2002incorporated herein by reference to Exhibit 10.31 of the Companys Form 10-K Annual Report for the year ended December 31, 2002.* | |
140
Table of Contents
| Exhibit No. |
||
| 10.18 | Employees Savings and Share Ownership Plan of Coca-Cola Ltd., effective as of January 1, 1990incorporated herein by reference to Exhibit 10.32 of the Companys Form 10-K Annual Report for the year ended December 31, 2002.* | |
| 10.19 | Share Purchase PlanDenmark, effective as of 1991incorporated herein by reference to Exhibit 10.33 of the Companys Form 10-K Annual Report for the year ended December 31, 2002.* | |
| 10.20.1 | The Coca-Cola Company Benefits Plan for Members of the Board of Directors, as amended and restated through April 14, 2004incorporated herein by reference to Exhibit 10.1 of the Companys Form 10-Q Quarterly Report for the quarter ended March 31, 2004.* | |
| 10.20.2 | Amendment Number One to the Companys Benefits Plan for Members of the Board of Directors, dated December 16, 2005incorporated herein by reference to Exhibit 10.31.2 of the Companys Form 10-K Annual Report for the year ended December 31, 2005.* | |
| 10.21 | Employment Agreement, dated as of March 11, 2002, between The Coca-Cola Export Corporation and Alexander R.C. Allanincorporated herein by reference to Exhibit 10.4 of the Companys Form 10-Q Quarterly Report for the quarter ended June 30, 2004.* | |
| 10.22 | Letter, dated September 16, 2004, from the Company to E. Neville Isdellincorporated herein by reference to Exhibit 99.1 of the Companys Form 8-K Current Report filed on September 17, 2004.* | |
| 10.23 | Stock Award Agreement for E. Neville Isdell, dated September 14, 2004, under the 1989 Restricted Stock Award Plan of the Companyincorporated herein by reference to Exhibit 99.2 of the Companys Form 8-K Current Report filed on September 17, 2004.* | |
| 10.24 | Stock Option Agreement for E. Neville Isdell, dated July 22, 2004, under the 2002 Stock Option Plan of the Company, as amendedincorporated herein by reference to Exhibit 10.3 of the Companys Form 10-Q Quarterly Report for the quarter ended September 30, 2004.* | |
| 10.25 | Letter, dated August 6, 2004, from the Chairman of the Compensation Committee of the Board of Directors of the Company to Douglas N. Daftincorporated herein by reference to Exhibit 10.5 of the Companys Form 10-Q Quarterly Report for the quarter ended September 30, 2004.* | |
| 10.26 | Letter, dated January 4, 2006, from the Company to Tom Mattiaincorporated herein by reference to Exhibit 10.40 of the Companys Form 10-K Annual Report for the year ended December 31, 2005.* | |
| 10.27 | Letter Agreement, dated October 7, 2004, between the Company and Daniel Palumboincorporated herein by reference to Exhibit 10.41 of the Companys Form 10-K Annual Report for the year ended December 31, 2004.* | |
| 10.28 | Letter, dated February 12, 2005, from the Company to Mary E. Minnickincorporated herein by reference to Exhibit 99.3 to the Companys Form 8-K Current Report filed on February 23, 2005.* | |
| 10.29 | Employment Agreement, dated as of February 20, 2003, between the Company and José Octavio Reyesincorporated herein by reference to Exhibit 10.43 of the Companys Form 10-K Annual Report for the year ended December 31, 2004.* | |
| 10.30 | Severance Pay Plan of the Company, including Amendments One through Three.* | |
| 10.31 | Employment Agreement, dated as of July 18, 2002, between the Company and Alexander B. Cummingsincorporated herein by reference to Exhibit 10.45 of the Companys Form 10-K Annual Report for the year ended December 31, 2004.* | |
| 10.32 | Employment Agreement, dated as of July 18, 2002, between The Coca-Cola Export Corporation and Alexander B. Cummingsincorporated herein by reference to Exhibit 10.46 of the Companys Form 10-K Annual Report for the year ended December 31, 2004.* | |
141
Table of Contents
| Exhibit No. |
||
| 10.33 | Order Instituting Cease and Desist Proceedings, Making Findings and Imposing a Cease-and-Desist Order Pursuant to Section 8A of the Securities Act of 1933 and Section 21C of the Securities Exchange Act of 1934incorporated herein by reference to Exhibit 99.2 of the Companys Form 8-K Current Report filed on April 18, 2005. | |
| 10.34 | Offer of Settlement of The Coca-Cola Companyincorporated herein by reference to Exhibit 99.2 of the Companys Form 8-K Current Report filed on April 18, 2005. | |
| 10.35 | Final Undertaking from The Coca-Cola Company and certain of its bottlers, adopted by the European Commission on June 22, 2005, relating to various commercial practices in the European Economic Areaincorporated herein by reference to Exhibit 99.1 of the Companys Form 8-K Current Report filed June 22, 2005. | |
| 10.36 | Employment Agreement, effective as of May 1, 2005, between Refreshment Services, S.A.S. and Dominique Reiniche, dated September 7, 2006incorporated herein by reference to Exhibit 99.1 of the Companys Form 8-K Current Report filed on September 12, 2006.* | |
| 10.37 | Refreshment Services S.A.S. Defined Benefit Plan, dated September 25, 2006incorporated herein by reference to Exhibit 10.3 of the Companys Form 10-Q Quarterly Report for the quarter ended September 29, 2006.* | |
| 10.38 | Share Purchase Agreement among Coca-Cola South Asia Holdings, Inc. and San Miguel Corporation, San Miguel Beverages (L) Pte Limited and San Miguel Holdings Limited in connection with the Companys purchase of Coca-Cola Bottlers Philippines, Inc., dated December 23, 2006incorporated herein by reference to Exhibit 99.1 of the Companys Form 8-K Current Report filed on December 29, 2006.* | |
| 10.39 | Cooperation Agreement between Coca-Cola South Asia Holdings, Inc. and San Miguel Corporation in connection with the Companys purchase of Coca-Cola Bottlers Philippines, Inc., dated December 23, 2006incorporated herein by reference to Exhibit 99.2 of the Companys Form 8-K Current Report filed on December 29, 2006.* | |
| 10.40 | Separation Agreement between The Coca-Cola Company and Mary Minnickincorporated herein by reference to Exhibit 99.1 to the Companys Current Report on Form 8-K filed on March 6, 2007.* | |
| 10.41 | Full and Complete Release and Agreement on Competition, Trade Secrets and Confidentiality between the Company and Mary Minnickincorporated herein by reference to Exhibit 99.2 of the Companys Form 8-K Current Report filed on March 6, 2007. | |
| 10.42 | Roll-Over Agreement among Tata Tea (GB) Investments Limited, Tata Limited and Mustang Acquisition Company, LLP, dated as of May 24, 2007incorporated herein by reference to Exhibit 99.1 to the Companys Current Report on Form 8-K filed on May 31, 2007. | |
| 10.43 | Put and Call Option Agreement among Tata Tea (GB) Limited, Tata Tea (GB) Investments Limited, Tata Limited and The Coca-Cola Company, dated as of May 24, 2007incorporated herein by reference to Exhibit 99.2 to the Companys Current Report on Form 8-K filed on May 31, 2007. | |
| 10.44 | Voting Agreement among Tata Limited, Tata Tea (GB) Investments Limited and The Coca-Cola Company, dated as of May 24, 2007incorporated herein by reference to Exhibit 99.3 to the Companys Current Report on Form 8-K filed on May 31, 2007. | |
| 10.45 | Supplemental Indemnity Agreement between J. Darius Bikoff and The Coca-Cola Company, dated May 24, 2007incorporated herein by reference to Exhibit 99.4 to the Companys Current Report on Form 8-K filed on May 31, 2007. | |
| 10.46 | Form of Investment Agreement, dated as of May 24, 2007, between each of J. Darius Bikoff, Michael Repole and Michael Venuti and The Coca-Cola Companyincorporated herein by reference to Exhibit 99.5 to the Companys Current Report on Form 8-K filed on May 31, 2007. | |
142
Table of Contents
| Exhibit No. |
||
| 10.47 | Offer Letter dated July 20, 2007 from the Company to Joseph V. Tripodi, including Agreement on Confidentiality, Non-Competition and Non-Solicitation, dated July 20, 2007incorporated herein by reference to Exhibit 10.1 to the Companys Form 10-Q Quarterly Report for the quarter ended September 28, 2007.* | |
| 12.1 | Computation of Ratios of Earnings to Fixed Charges for the years ended December 31, 2007, 2006, 2005, 2004 and 2003 | |
| 21.1 | List of subsidiaries of the Company as of December 31, 2007. | |
| 23.1 | Consent of Independent Registered Public Accounting Firm. | |
| 24.1 | Powers of Attorney of Officers and Directors signing this report. | |
| 31.1 | Rule 13a-14(a)/15d-14(a) Certification, executed by E. Neville Isdell, Chairman, Board of Directors, and Chief Executive Officer of The Coca-Cola Company. | |
| 31.2 | Rule 13a-14(a)/15d-14(a) Certification, executed by Gary P. Fayard, Executive Vice President and Chief Financial Officer of The Coca-Cola Company. | |
| 32.1 | Certifications required by Rule 13a-14(b) or Rule 15d-14(b) and Section 1350 of Chapter 63 of Title 18 of the United States Code (18 U.S.C. 1350), executed by E. Neville Isdell, Chairman, Board of Directors, and Chief Executive Officer of The Coca-Cola Company and by Gary P. Fayard, Executive Vice President and Chief Financial Officer of The Coca-Cola Company. | |
| * | Management contracts and compensatory plans and arrangements required to be filed as exhibits pursuant to Item 15(c) of this report. |
143
Table of Contents
Pursuant to the requirements of Section 13 or 15(d) of the Securities Exchange Act of 1934, the Registrant has duly caused this report to be signed on its behalf by the undersigned, thereunto duly authorized.
| THE COCA-COLA COMPANY (Registrant) |
||
| By: |
/s/ E. NEVILLE ISDELL |
|
| E. NEVILLE ISDELL Chairman, Board of Directors, and Chief Executive Officer |
||
|
Date: February 28, 2008 |
||
Pursuant to the requirements of the Securities Exchange Act of 1934, this report has been signed below by the following persons on behalf of the Registrant and in the capacities and on the dates indicated.
| /s/ E. NEVILLE ISDELL |
* |
|
| E. NEVILLE ISDELL | RONALD ALLEN | |
| Chairman, Board of Directors, Chief Executive Officer and a Director (Principal Executive Officer) |
Director | |
| February 28, 2008 | February 28, 2008 | |
| /s/ GARY P. FAYARD |
* |
|
| GARY P. FAYARD | CATHLEEN P. BLACK | |
| Executive Vice President and Chief Financial Officer (Principal Financial Officer) |
Director | |
| February 28, 2008 | February 28, 2008 | |
| /s/ HARRY L. ANDERSON |
* |
|
| HARRY L. ANDERSON | BARRY DILLER | |
| Vice President and Controller (Principal Accounting Officer) |
Director | |
| February 28, 2008 | February 28, 2008 | |
| * |
* |
|
| HERBERT A. ALLEN | ALEXIS M. HERMAN | |
| Director | Director | |
| February 28, 2008 | February 28, 2008 | |
144
Table of Contents
| * |
* |
|
| DONALD R. KEOUGH | DONALD F. MCHENRY | |
| Director | Director | |
| February 28, 2008 | February 28, 2008 | |
| * |
* |
|
| SAM NUNN |
JAMES D. ROBINSON III | |
| Director |
Director | |
| February 28, 2008 |
February 28, 2008 | |
| * |
* |
|
| PETER V. UEBERROTH |
JACOB WALLENBERG |
|
| Director |
Director | |
| February 28, 2008 |
February 28, 2008 | |
| * |
||
| JAMES B. WILLIAMS |
||
| Director |
||
| February 28, 2008 |
||
| *By: |
/s/ CAROL CROFOOT HAYES |
|
| CAROL CROFOOT HAYES Attorney-in-fact February 28, 2008 |
||
145
Table of Contents
EXHIBIT INDEX
| Exhibit No. |
||
| 2.1 | Control and Profit and Loss Transfer Agreement, dated November 21, 2001, between Coca-Cola GmbH and Coca-Cola Erfrischungsgetraenke AGincorporated herein by reference to Exhibit 2 of the Companys Form 10-Q Quarterly Report for the quarter ended March 31, 2002. (With regard to applicable cross-references in this report, the Companys Current, Quarterly and Annual Reports are filed with the SEC under File No. 1-2217.) | |
| 2.2 | Agreement and Plan of Merger by and among The Coca-Cola Company, Mustang Acquisition Company, LLP, Energy Brands Inc. d/b/a Glaceau, and the Stockholder Representatives identified therein, dated as of May 24, 2007 incorporated herein by reference to Exhibit 2.1 to the Companys Current Report on Form 8-K filed May 31, 2007. In accordance with Item 601(b)(2) of Regulation S-X, the disclosure schedules to the Agreement and Plan of Merger were not filed. The Agreement and Plan of Merger contains a list briefly identifying the contents of all omitted disclosure schedules and the Company hereby agrees to furnish supplementally a copy of any omitted disclosure schedule to the Securities and Exchange Commission upon request. | |
| 3.1 | Certificate of Incorporation of the Company, including Amendment of Certificate of Incorporation, effective May 1, 1996incorporated herein by reference to Exhibit 3 of the Companys Form 10-Q Quarterly Report for the quarter ended March 31, 1996. | |
| 3.2 | By-Laws of the Company, as amended and restated through October 19, 2006 incorporated herein by reference to Exhibit 99.1 of the Companys Form 8-K Current Report, filed October 20, 2006. | |
| 4.1 | The Company agrees to furnish to the Securities and Exchange Commission, upon request, a copy of any instrument defining the rights of holders of long-term debt of the Company and all of its consolidated subsidiaries and unconsolidated subsidiaries for which financial statements are required to be filed with the SEC. | |
| 4.2 | Form of Note for 5.350% Notes due November 15, 2017incorporated herein by reference to Exhibit 4.1 to the Companys Current Report on Form 8-K filed October 31, 2007 | |
| 10.1 | Supplemental Disability Plan of the Company, as amended and restated effective January 1, 2003incorporated herein by reference to Exhibit 10.2 of the Companys Form 10-K Annual Report for the year ended December 31, 2002.* | |
Table of Contents
| Exhibit No. |
||
| 10.2 | Performance Incentive Plan of the Company, as amended and restated December 13, 2006incorporated herein by reference to Exhibit 10.3 to the Companys Annual Report on Form 10-K for the year ended December 31, 2006.* | |
| 10.3 | 1991 Stock Option Plan of the Company, as amended and restated through December 13, 2006incorporated herein by reference to Exhibit 10.4 to the Companys Annual Report on Form 10-K for the year ended December 31, 2006.* | |
| 10.4.1 | 1999 Stock Option Plan of the Company, as amended and restated through December 1, 2007incorporated herein by reference to Exhibit 10.2 to the Companys Form 8-K Current Report, filed February 21, 2008.* | |
| 10.4.2 | Form of Stock Option Agreement in connection with the 1999 Stock Option Plan of the Companyincorporated herein by reference to Exhibit 99.1 of the Companys Form 8-K Current Report filed February 14, 2007.* | |
| 10.4.3 | Form of Stock Option Agreement for E. Neville Isdell in connection with the 1999 Stock Option Plan of the Companyincorporated herein by reference to Exhibit 99.2 of the Companys Form 8-K Current Report filed February 14, 2007.* | |
| 10.4.4 | Form of Stock Option Agreement for E. Neville Isdell in connection with the 1999 Stock Option Plan of the Company, as adopted December 12, 2007incorporated herein by reference to Exhibit 10.7 of the Companys Form 8-K Current Report filed February 21 2008.* | |
| 10.4.5 | Form of Stock Option Agreement in connection with the 1999 Stock Option Plan of the Company, as adopted December 12, 2007incorporated herein by reference to Exhibit 10.8 of the Companys Form 8-K Current Report filed February 21 2008.* | |
| 10.5.1 | 2002 Stock Option Plan of the Company, as amended and restated through December 1, 2007incorporated herein by reference to Exhibit 10.3 to the Companys Form 8-K Current Report, filed February 21, 2008.* | |
| 10.5.2 | Form of Stock Option Agreement in connection with the 2002 Stock Option Plan, as amendedincorporated herein by reference to Exhibit 99.1 of the Companys Form 8-K Current Report filed on December 8, 2004.* | |
| 10.5.3 | Form of Stock Option Agreement for E. Neville Isdell in connection with the 2002 Stock Option Plan, as amendedincorporated herein by reference to Exhibit 99.1 of the Companys Form 8-K Current Report filed February 23, 2005.* | |
| 10.5.4 | Form of Stock Option Agreement in connection with the 2002 Stock Option Plan, as adopted December 12, 2007incorporated herein by reference to 10.9 of the Companys Form 8-K Current Report filed on February 21, 2008.* | |
| 10.6 | 1983 Restricted Stock Award Plan of the Company, as amended through December 1, 2007.* | |
| 10.7.1 | 1989 Restricted Stock Award Plan of the Company, as amended through February 20, 2008incorporated herein by reference to Exhibit 10.1 to the Companys Form 8-K Current Report, filed February 21, 2008.* | |
| 10.7.2 | Form of Restricted Stock Agreement (Performance Share Unit Agreement) in connection with the 1989 Restricted Stock Award Plan of the Companyincorporated herein by reference to Exhibit 10.1 of the Companys Form 8-K Current Report filed April 19, 2005.* | |
Table of Contents
| Exhibit No. |
||
| 10.7.3 | Form of Restricted Stock Agreement (Performance Share Unit Agreement) in connection with the 1989 Restricted Stock Award Plan of the Company, effective as of December 2005incorporated herein by reference to Exhibit 99.1 of the Companys Form 8-K Current Report filed December 14, 2005.* | |
| 10.7.4 | Form of Restricted Stock Agreement (Performance Share Unit Agreement) for E. Neville Isdell in connection with the 1989 Restricted Stock Award Plan of the Company, as amendedincorporated herein by reference to Exhibit 99.2 of the Companys Form 8-K Current Report filed on February 23, 2005.* | |
| 10.7.5 | Form of Restricted Stock Agreement (Performance Share Unit Agreement) in connection with the 1989 Restricted Stock Award Plan of the Companyincorporated herein by reference to Exhibit 99.2 of the Companys Form 8-K Current Report filed on February 15, 2006.* | |
| 10.7.6 | Form of Restricted Stock Agreement (Performance Share Unit Agreement) for E. Neville Isdell in connection with the 1989 Restricted Stock Award Plan of the Companyincorporated herein by reference to Exhibit 99.1 of the Companys Form 8-K Current Report filed on February 17, 2006.* | |
| 10.7.7 | Form of Restricted Stock Agreement (Performance Share Unit Agreement) in connection with the 1989 Restricted Stock Award Plan of the Companyincorporated herein by reference to Exhibit 99.3 of the Companys Form 8-K Current Report filed February 14, 2007.* | |
| 10.7.8 | Form of Restricted Stock Agreement (Performance Share Unit Agreement) for E. Neville Isdell in connection with the 1989 Restricted Stock Award Plan of the Company, as adopted December 12, 2007incorporated herein by reference to Exhibit 10.4 of the Companys Form 8-K Current Report filed February 21, 2008.* | |
| 10.7.9 | Form of Restricted Stock Agreement (Performance Share Unit Agreement) in connection with the 1989 Restricted Stock Award Plan of the Company, as adopted December 12, 2007incorporated herein by reference to Exhibit 10.5 of the Companys Form 8-K Current Report filed February 21, 2008.* | |
| 10.7.10 | Form of Restricted Stock Agreement (Performance Share Unit Agreement) for France in connection with the 1989 Restricted Stock Award Plan of the Company, as adopted December 12, 2007incorporated herein by reference to Exhibit 10.6 of the Companys Form 8-K Current Report filed February 21, 2008.* | |
| 10.8.1 | Compensation Deferral & Investment Program of the Company, as amended, including Amendment Number Four dated November 28, 1995incorporated herein by reference to Exhibit 10.13 of the Companys Form 10-K Annual Report for the year ended December 31, 1995.* | |
| 10.8.2 | Amendment Number Five to the Compensation Deferral & Investment Program of the Company, effective as of January 1, 1998incorporated herein by reference to Exhibit 10.8.2 of the Companys Form 10-K Annual Report for the year ended December 31, 1997.* | |
| 10.8.3 | Amendment Number Six to the Compensation Deferral & Investment Program of the Company, dated as of January 12, 2004, effective January 1, 2004incorporated herein by reference to Exhibit 10.9.3 of the Companys Form 10-K Annual Report for the year ended December 31, 2003.* | |
| 10.9.1 | Executive Medical Plan of the Company, as amended and restated effective January 1, 2001incorporated herein by reference to Exhibit 10.10 of the Companys Form 10-K Annual Report for the year ended December 31, 2002.* | |
Table of Contents
| Exhibit No. |
||
| 10.9.2 | Amendment Number One to the Executive Medical Plan of the Company, dated April 15, 2003incorporated herein by reference to Exhibit 10.1 of the Companys Form 10-Q Quarterly Report for the quarter ended June 30, 2003.* | |
| 10.9.3 | Amendment Number Two to the Executive Medical Plan of the Company, dated August 27, 2003incorporated herein by reference to Exhibit 10 of the Companys Form 10-Q Quarterly Report for the quarter ended September 30, 2003.* | |
| 10.9.4 | Amendment Number Three to the Executive Medical Plan of the Company, dated December 29, 2004, effective January 1, 2005incorporated herein by reference to Exhibit 10.10.4 of the Companys Form 10-K Annual Report for the year ended December 31, 2004.* | |
| 10.9.5 | Amendment Number Four to the Executive Medical Plan of the Companyincorporated herein by reference to Exhibit 10.6 of the Companys Form 10-Q Quarterly Report for the quarter ended July 1, 2005.* | |
| 10.9.6 | Amendment Number Five to the Executive Medical Plan of the Company, dated December 20, 2005incorporated herein by reference to Exhibit 10.10.6 of the Companys Form 10-K Annual Report for the year ended December 31, 2005.* | |
| 10.10.1 | Supplemental Benefit Plan of the Company, as amended and restated effective January 1, 2002incorporated herein by reference to Exhibit 10.11 of the Companys Form 10-K Annual Report for the year ended December 31, 2002.* | |
| 10.10.2 | Amendment One to the Supplemental Benefit Plan of the Company, dated as of February 27, 2003 incorporated herein by reference to Exhibit 10.5 of the Companys Form 10-Q Quarterly Report for the quarter ended March 31, 2003.* | |
| 10.10.3 | Amendment Two to the Supplemental Benefit Plan of the Company, dated as of November 14, 2003, effective October 21, 2003incorporated herein by reference to Exhibit 10.11.3 of the Companys Form 10-K Annual Report for the year ended December 31, 2003.* | |
| 10.10.4 | Amendment Three to the Supplemental Benefit Plan of the Company, dated April 14, 2004, effective as of January 1, 2004incorporated herein by reference to Exhibit 10.3 of the Companys Form 10-Q Quarterly Report for the quarter ended March 31, 2004.* | |
| 10.10.5 | Amendment Four to the Supplemental Benefit Plan of the Company, dated December 15, 2004, effective January 1, 2005incorporated herein by reference to Exhibit 10.11.5 of the Companys Form 10-K Annual Report for the year ended December 31, 2004.* | |
| 10.10.6 | Amendment Five to the Supplemental Benefit Plan of the Company, dated December 21, 2005incorporated herein by reference to Exhibit 10.11.6 of the Companys Form 10-K Annual Report for the year ended December 31, 2005.* | |
| 10.10.7 | Amendment Six to the Supplemental Benefit Plan of the Company, dated July 18, 2006incorporated herein by reference to Exhibit 10.3 of the Companys Form 10-Q Quarterly Report for the quarter ended June 30, 2006.* | |
| 10.11 | The Coca-Cola Company Deferred Compensation Plan for Non-Employee Directors, as amended and restated effective April 1, 2006incorporated herein by reference to Exhibit 99.2 of the Companys Form 8-K Current Report filed April 5, 2006.* | |
| 10.12 | Compensation Plan for Non-Employee Directors of The Coca-Cola Company, as amended and restated on December 13, 2007incorporated herein by reference to Exhibit 99.1 of the Companys Form 8-K Current Report filed on December 19, 2007. | |
Table of Contents
| Exhibit No. |
||
| 10.13 | Long-Term Performance Incentive Plan of the Company, as amended and restated effective December 13, 2006.* | |
| 10.14 | Executive Incentive Plan of the Company, adopted as of February 14, 2001incorporated herein by reference to Exhibit 10.19 of the Companys Form 10-K Annual Report for the year ended December 31, 2000.* | |
| 10.15 | Form of United States Master Bottler Contract between the Company and Coca-Cola Enterprises Inc. (Coca-Cola Enterprises) or its subsidiariesincorporated herein by reference to Exhibit 10.24 of Coca-Cola Enterprises Annual Report on Form 10-K for the fiscal year ended December 30, 1988 (File No. 01-09300). | |
| 10.16.1 | Deferred Compensation Plan of the Company, as amended and restated December 17, 2003incorporated herein by reference to Exhibit 10.26.1 of the Companys Form 10-K Annual Report for the year ended December 31, 2003.* | |
| 10.16.2 | Deferred Compensation Plan Delegation of Authority from the Compensation Committee to the Management Committee, adopted as of December 17, 2003incorporated herein by reference to Exhibit 10.26.2 of the Companys Form 10-K Annual Report for the year ended December 31, 2003.* | |
| 10.16.3 | Amendment One to the Deferred Compensation Plan of the Company, as amended and restated effective December 17, 2003incorporated herein by reference to Exhibit 10.24.3 of the Companys Form 10-K Annual Report for the year ended December 31, 2005.* | |
| 10.17 | The Coca-Cola Export Corporation Employee Share Plan, effective as of March 13, 2002incorporated herein by reference to Exhibit 10.31 of the Companys Form 10-K Annual Report for the year ended December 31, 2002.* | |
| 10.18 | Employees Savings and Share Ownership Plan of Coca-Cola Ltd., effective as of January 1, 1990incorporated herein by reference to Exhibit 10.32 of the Companys Form 10-K Annual Report for the year ended December 31, 2002.* | |
| 10.19 | Share Purchase PlanDenmark, effective as of 1991incorporated herein by reference to Exhibit 10.33 of the Companys Form 10-K Annual Report for the year ended December 31, 2002.* | |
| 10.20.1 | The Coca-Cola Company Benefits Plan for Members of the Board of Directors, as amended and restated through April 14, 2004incorporated herein by reference to Exhibit 10.1 of the Companys Form 10-Q Quarterly Report for the quarter ended March 31, 2004.* | |
| 10.20.2 | Amendment Number One to the Companys Benefits Plan for Members of the Board of Directors, dated December 16, 2005incorporated herein by reference to Exhibit 10.31.2 of the Companys Form 10-K Annual Report for the year ended December 31, 2005.* | |
Table of Contents
| Exhibit No. |
||
| 10.21 | Employment Agreement, dated as of March 11, 2002, between The Coca-Cola Export Corporation and Alexander R.C. Allanincorporated herein by reference to Exhibit 10.4 of the Companys Form 10-Q Quarterly Report for the quarter ended June 30, 2004.* | |
| 10.22 | Letter, dated September 16, 2004, from the Company to E. Neville Isdellincorporated herein by reference to Exhibit 99.1 of the Companys Form 8-K Current Report filed on September 17, 2004.* | |
| 10.23 | Stock Award Agreement for E. Neville Isdell, dated September 14, 2004, under the 1989 Restricted Stock Award Plan of the Companyincorporated herein by reference to Exhibit 99.2 of the Companys Form 8-K Current Report filed on September 17, 2004.* | |
| 10.24 | Stock Option Agreement for E. Neville Isdell, dated July 22, 2004, under the 2002 Stock Option Plan of the Company, as amendedincorporated herein by reference to Exhibit 10.3 of the Companys Form 10-Q Quarterly Report for the quarter ended September 30, 2004.* | |
| 10.25 | Letter, dated August 6, 2004, from the Chairman of the Compensation Committee of the Board of Directors of the Company to Douglas N. Daftincorporated herein by reference to Exhibit 10.5 of the Companys Form 10-Q Quarterly Report for the quarter ended September 30, 2004.* | |
| 10.26 | Letter, dated January 4, 2006, from the Company to Tom Mattiaincorporated herein by reference to Exhibit 10.40 of the Companys Form 10-K Annual Report for the year ended December 31, 2005.* | |
| 10.27 | Letter Agreement, dated October 7, 2004, between the Company and Daniel Palumboincorporated herein by reference to Exhibit 10.41 of the Companys Form 10-K Annual Report for the year ended December 31, 2004.* | |
| 10.28 | Letter, dated February 12, 2005, from the Company to Mary E. Minnickincorporated herein by reference to Exhibit 99.3 to the Companys Form 8-K Current Report filed on February 23, 2005.* | |
| 10.29 | Employment Agreement, dated as of February 20, 2003, between the Company and José Octavio Reyesincorporated herein by reference to Exhibit 10.43 of the Companys Form 10-K Annual Report for the year ended December 31, 2004.* | |
| 10.30 | Severance Pay Plan of the Company, including Amendments One through Three.* | |
| 10.31 | Employment Agreement, dated as of July 18, 2002, between the Company and Alexander B. Cummingsincorporated herein by reference to Exhibit 10.45 of the Companys Form 10-K Annual Report for the year ended December 31, 2004.* | |
| 10.32 | Employment Agreement, dated as of July 18, 2002, between The Coca-Cola Export Corporation and Alexander B. Cummingsincorporated herein by reference to Exhibit 10.46 of the Companys Form 10-K Annual Report for the year ended December 31, 2004.* | |
| 10.33 | Order Instituting Cease and Desist Proceedings, Making Findings and Imposing a Cease-and-Desist Order Pursuant to Section 8A of the Securities Act of 1933 and Section 21C of the Securities Exchange Act of 1934incorporated herein by reference to Exhibit 99.2 of the Companys Form 8-K Current Report filed on April 18, 2005. | |
| 10.34 | Offer of Settlement of The Coca-Cola Companyincorporated herein by reference to Exhibit 99.2 of the Companys Form 8-K Current Report filed on April 18, 2005. | |
| 10.35 | Final Undertaking from The Coca-Cola Company and certain of its bottlers, adopted by the European Commission on June 22, 2005, relating to various commercial practices in the European Economic Areaincorporated herein by reference to Exhibit 99.1 of the Companys Form 8-K Current Report filed June 22, 2005. | |
Table of Contents
| Exhibit No. |
||
| 10.36 | Employment Agreement, effective as of May 1, 2005, between Refreshment Services, S.A.S. and Dominique Reiniche, dated September 7, 2006incorporated herein by reference to Exhibit 99.1 of the Companys Form 8-K Current Report filed on September 12, 2006.* | |
| 10.37 | Refreshment Services S.A.S. Defined Benefit Plan, dated September 25, 2006incorporated herein by reference to Exhibit 10.3 of the Companys Form 10-Q Quarterly Report for the quarter ended September 29, 2006.* | |
| 10.38 | Share Purchase Agreement among Coca-Cola South Asia Holdings, Inc. and San Miguel Corporation, San Miguel Beverages (L) Pte Limited and San Miguel Holdings Limited in connection with the Companys purchase of Coca-Cola Bottlers Philippines, Inc., dated December 23, 2006incorporated herein by reference to Exhibit 99.1 of the Companys Form 8-K Current Report filed on December 29, 2006.* | |
| 10.39 | Cooperation Agreement between Coca-Cola South Asia Holdings, Inc. and San Miguel Corporation in connection with the Companys purchase of Coca-Cola Bottlers Philippines, Inc., dated December 23, 2006incorporated herein by reference to Exhibit 99.2 of the Companys Form 8-K Current Report filed on December 29, 2006.* | |
| 10.40 | Separation Agreement between The Coca-Cola Company and Mary Minnickincorporated herein by reference to Exhibit 99.1 to the Companys Current Report on Form 8-K filed on March 6, 2007.* | |
| 10.41 | Full and Complete Release and Agreement on Competition, Trade Secrets and Confidentiality between the Company and Mary Minnickincorporated herein by reference to Exhibit 99.2 of the Companys Form 8-K Current Report filed on March 6, 2007. | |
| 10.42 | Roll-Over Agreement among Tata Tea (GB) Investments Limited, Tata Limited and Mustang Acquisition Company, LLP, dated as of May 24, 2007incorporated herein by reference to Exhibit 99.1 to the Companys Current Report on Form 8-K filed on May 31, 2007. | |
| 10.43 | Put and Call Option Agreement among Tata Tea (GB) Limited, Tata Tea (GB) Investments Limited, Tata Limited and The Coca-Cola Company, dated as of May 24, 2007incorporated herein by reference to Exhibit 99.2 to the Companys Current Report on Form 8-K filed on May 31, 2007. | |
| 10.44 | Voting Agreement among Tata Limited, Tata Tea (GB) Investments Limited and The Coca-Cola Company, dated as of May 24, 2007incorporated herein by reference to Exhibit 99.3 to the Companys Current Report on Form 8-K filed on May 31, 2007. | |
| 10.45 | Supplemental Indemnity Agreement between J. Darius Bikoff and The Coca-Cola Company, dated May 24, 2007incorporated herein by reference to Exhibit 99.4 to the Companys Current Report on Form 8-K filed on May 31, 2007. | |
| 10.46 | Form of Investment Agreement, dated as of May 24, 2007, between each of J. Darius Bikoff, Michael Repole and Michael Venuti and The Coca-Cola Companyincorporated herein by reference to Exhibit 99.5 to the Companys Current Report on Form 8-K filed on May 31, 2007. | |
| 10.47 | Offer Letter dated July 20, 2007 from the Company to Joseph V. Tripodi, including Agreement on Confidentiality, Non-Competition and Non-Solicitation, dated July 20, 2007incorporated herein by reference to Exhibit 10.1 to the Companys Form 10-Q Quarterly Report for the quarter ended September 28, 2007.* | |
| 12.1 | Computation of Ratios of Earnings to Fixed Charges for the years ended December 31, 2007, 2006, 2005, 2004 and 2003 | |
| 21.1 | List of subsidiaries of the Company as of December 31, 2007. | |
| 23.1 | Consent of Independent Registered Public Accounting Firm. | |
| 24.1 | Powers of Attorney of Officers and Directors signing this report. | |
Table of Contents
| Exhibit No. |
||
| 31.1 | Rule 13a-14(a)/15d-14(a) Certification, executed by E. Neville Isdell, Chairman, Board of Directors, and Chief Executive Officer of The Coca-Cola Company. | |
| 31.2 | Rule 13a-14(a)/15d-14(a) Certification, executed by Gary P. Fayard, Executive Vice President and Chief Financial Officer of The Coca-Cola Company. | |
| 32.1 | Certifications required by Rule 13a-14(b) or Rule 15d-14(b) and Section 1350 of Chapter 63 of Title 18 of the United States Code (18 U.S.C. 1350), executed by E. Neville Isdell, Chairman, Board of Directors, and Chief Executive Officer of The Coca-Cola Company and by Gary P. Fayard, Executive Vice President and Chief Financial Officer of The Coca-Cola Company. | |
| * | Management contracts and compensatory plans and arrangements required to be filed as exhibits pursuant to Item 15(c) of this report. |