Committed to Enduring Long-Term Growth
Executing On Our All-Weather Strategy
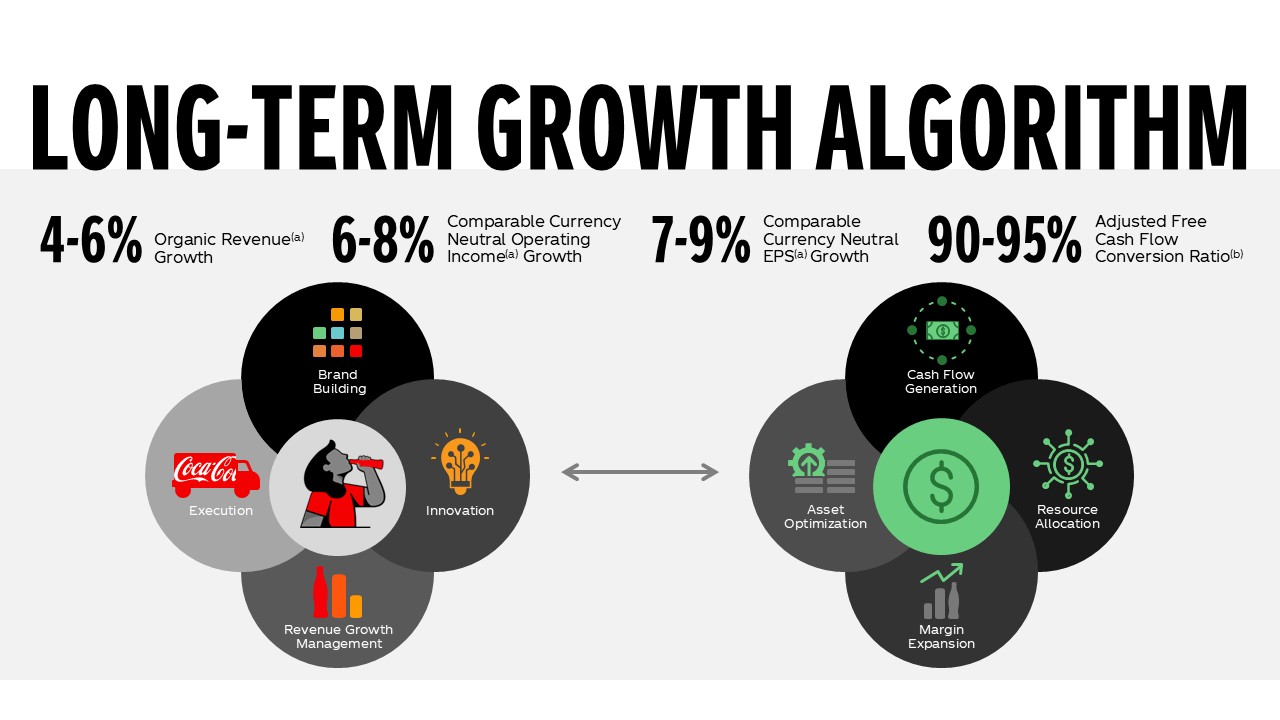
We believe we’re well positioned to deliver long-term balanced growth as several underpinnings remain constant:
- We operate in a great industry that has a compelling pattern of growth;
- We have many opportunities available to us, and we are primed to capture these and deliver sustained performance;
- Our powerful portfolio of brands, pervasive distribution system and the unwavering dedication of our system employees are clear advantages
Our ability to create enduring value over time has been a hallmark of our company since its inception, and the three strengths outlined above give us confidence in our ability to continue to do so.
Relentless Focus on Value Creation
Despite what remains a dynamic operating environment, we continue to deliver results ahead of CPG peers. Our continued efforts to curate a powerful portfolio of growth brands are reflected in the longevity of our business momentum, as our top-line growth, margin expansion, cash flow generation, and return profile have outpaced CPG peers since 2017.
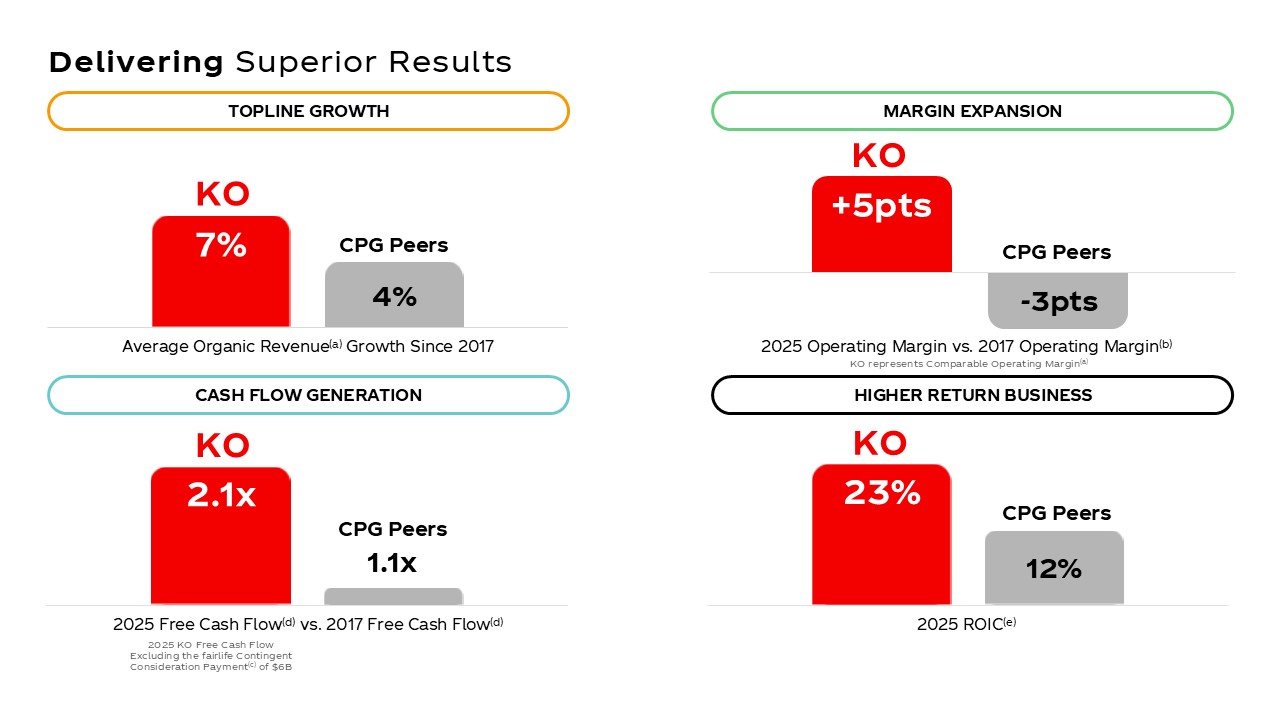
Note: Consumer packaged goods (CPG) represents select large cap, food, household products and beverage peers. 2025 amounts are based on year-to-date Q3 except for KO, which is based on full year 2025. All data obtained from FactSet. (a) Non-GAAP; (b) KO comparable operating margin (Non-GAAP) and CPG peer operating margin; (c) 2025 free cash flow excluding the fairlife contingent consideration payment = net cash provided by operating activities less purchases of property, plant and equipment and excludes the Company’s fairlife contingent consideration payment that was made in 2025, Non-GAAP; (d) Free cash flow = net cash provided by operating activities less purchases of property, plant and equipment, Non-GAAP; (e) Return on Invested Capital (ROIC) = Comparable Net Operating Profit After Tax (NOPAT) divided by two-year average of invested capital; Non-GAAP.
Our company has expanded margins while increasing investment in the business. Quality leadership, defined as our share position relative to competitors’ share position, is closely connected with margins. By continuing to leverage data throughout the P&L, we’re achieving greater granularity which is allowing our dollars to go further. Our global scale also affords us with a unique competitive advantage in our supply chain. As the benefits from our marketing transformation continue to take hold, we see additional effectiveness and efficiency opportunities to fuel topline growth and drive margin expansion.
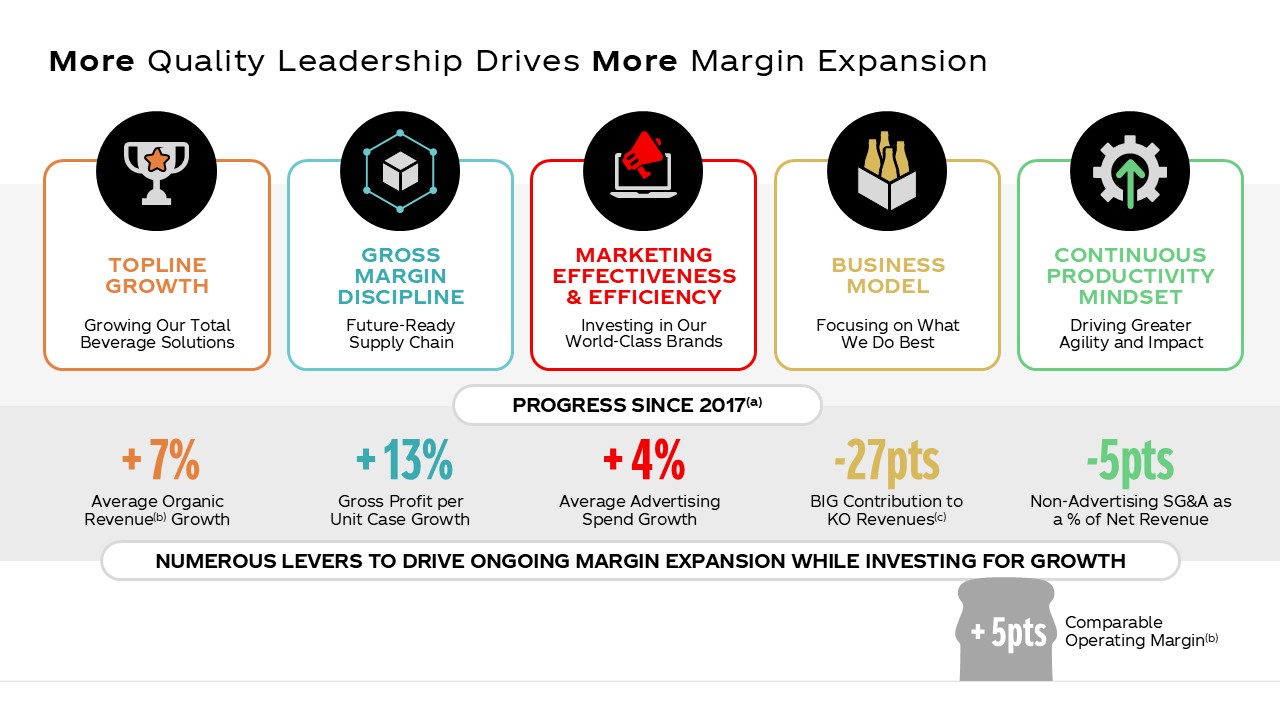
(a) 12/31/2025 vs. 12/31/2017; (b) Non-GAAP; (c) 2025 Bottling Investments net revenues excluding Coca-Cola Beverages Africa (“CCBA”) as a percentage of total Company net revenues. CCBA has been excluded from the calculation as it met the criteria to be classified as held for sale as of October 2025.
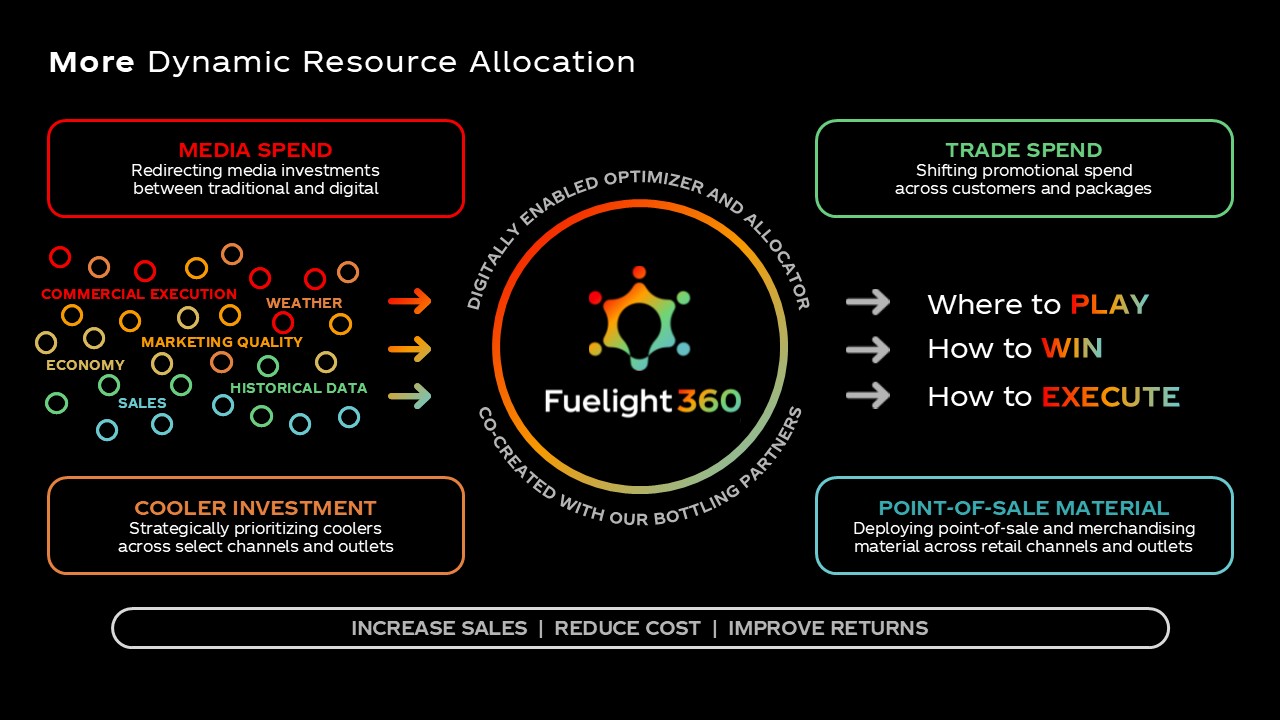
Our company's topline growth strategy is driven by dynamic resource allocation, ensuring balanced and quality growth through smarter spending. Each country-category combination in our portfolio has a specific role, and we continually track performance to optimize resource allocation. In areas of strong leadership, we aim to grow gross profit ahead of marketing investment, while in emerging areas, we prioritize marketing investments to build leadership. Additionally, we’ve been developing a new capability through Fuelight360, our bespoke digital platform which allows us to optimize system spend end-to-end unique to each market. Though still in its early stages, Fuelight360 is unlocking new opportunities and delivering more meaningful outputs targeting greater return on spend. This disciplined approach underscores our belief that quality leadership and strategic investment drive profitability.
Driving More Steady Cash Flow Generation
Consistently delivering on the top line has transformed our ability to sustainably deliver on the bottom line. Despite a few anomalous items in recent years, underlying cash flow generation has been a strength of the business and is enabling us to continue to invest appropriately in higher-returning areas.
As such, we have maintained our strong free cash flow trajectory by focusing on strategic investments that will further our growth and ensure long-term financial health.
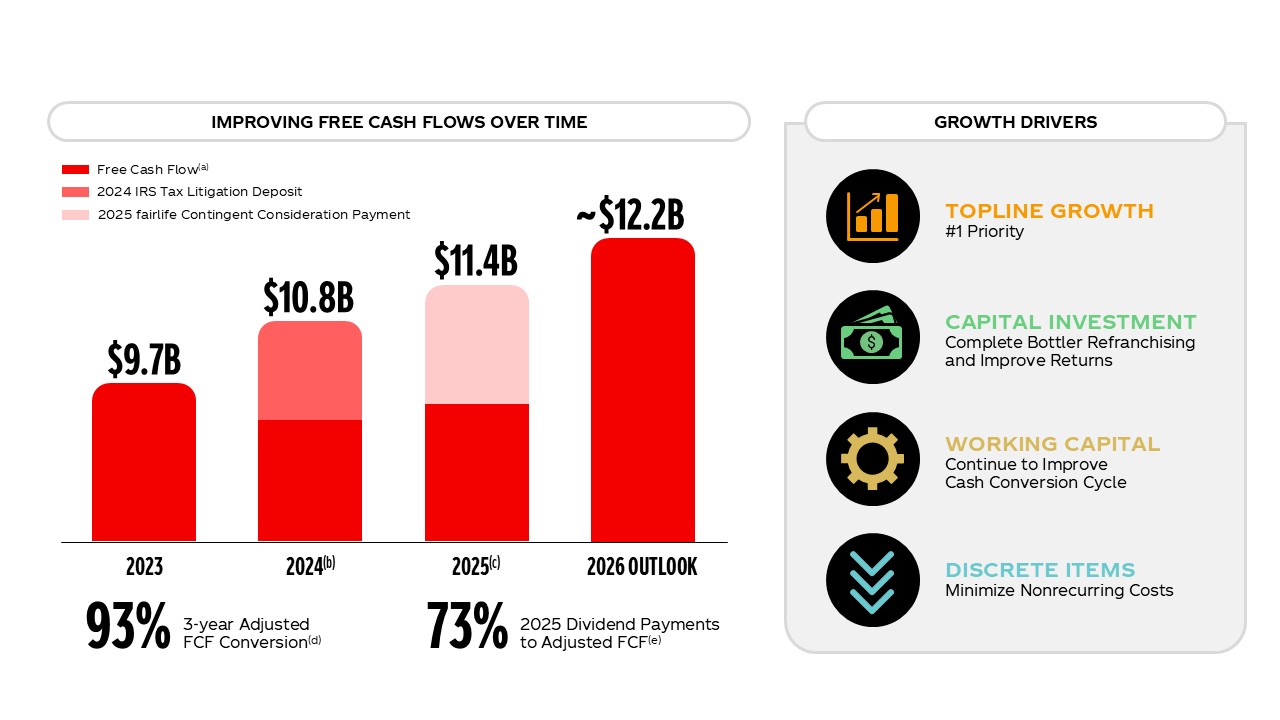
(a) Free cash flow = net cash provided by operating activities less purchases of property, plant and equipment, Non-GAAP; (b) Free cash flow excluding the IRS tax litigation deposit = free cash flow excluding the Company’s IRS tax litigation deposit that was paid in 2024, Non-GAAP; (c) Free cash flow excluding the fairlife contingent consideration payment = free cash flow excluding the Company’s fairlife contingent consideration payment that was made in 2025, Non-GAAP;
(d) 2023-2025, Adjusted Free Cash Flow Conversion Ratio = Free cash flow adjusted for significant cash inflows & outflows / GAAP net income adjusted for noncash/nonoperating items impacting comparability, Non-GAAP; (e) Non-GAAP
Getting More from Our Balance Sheet
Balance sheet strength and flexibility are essential to supporting our ambitious growth agenda, and we have taken a holistic approach to optimizing our investments to drive the business. By progressing our "fit-for-purpose" balance sheet agenda and making progress on our refranchising journey, we allow ourselves and our bottling partners to focus on core competencies. Our net revenue contribution excluding Bottling Investments has increased from 48% in 2015 to 96% in 2025 (excluding CCBA), while our Return on Invested Capital has increased by 6 points over the same time period. This strategic approach ensures that our global franchise model remains an advantage, positioning us for long-term enduring growth.
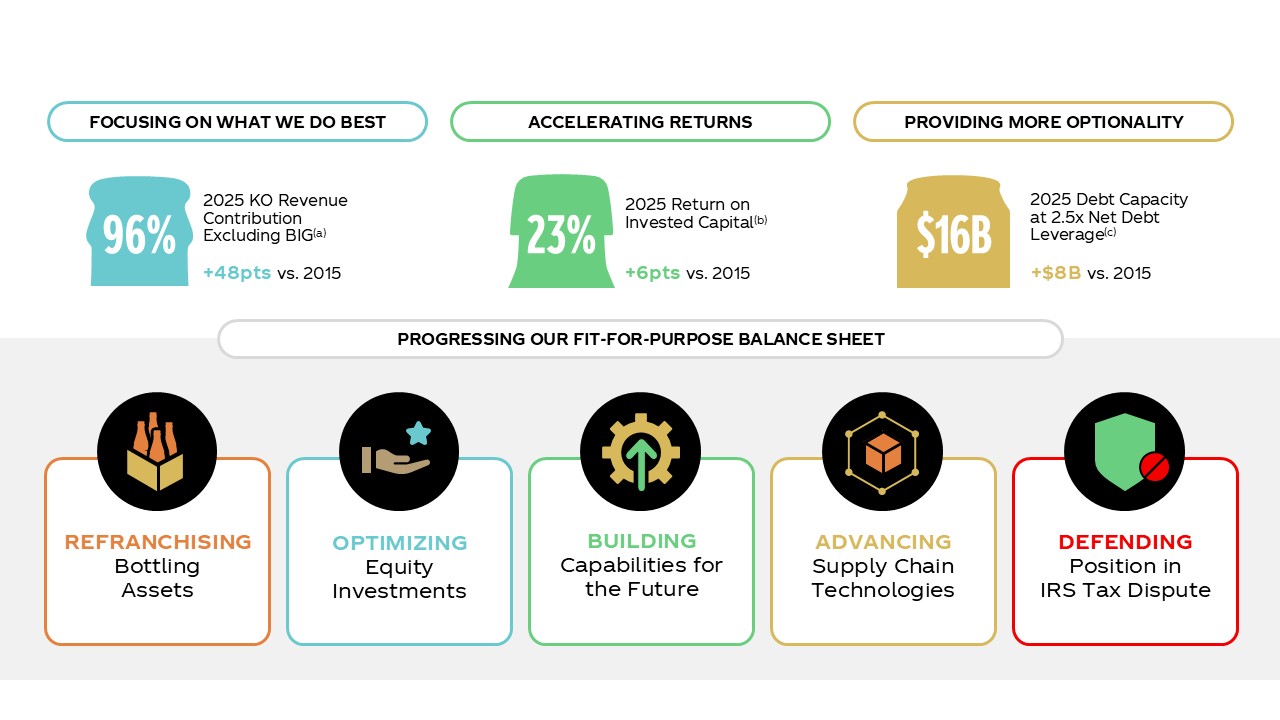
(a) 2025 total Company net revenues less 2025 Bottling Investments net revenues excluding CCBA as a percentage of total Company net revenues; (b) Return on Invested Capital (ROIC) = Comparable Net Operating Profit After Tax (NOPAT) divided by two-year average of invested capital, Non-GAAP; (c) Debt Capacity = High end of target net debt leverage minus current net debt leverage multiplied by Comparable EBITDA, Non-GAAP
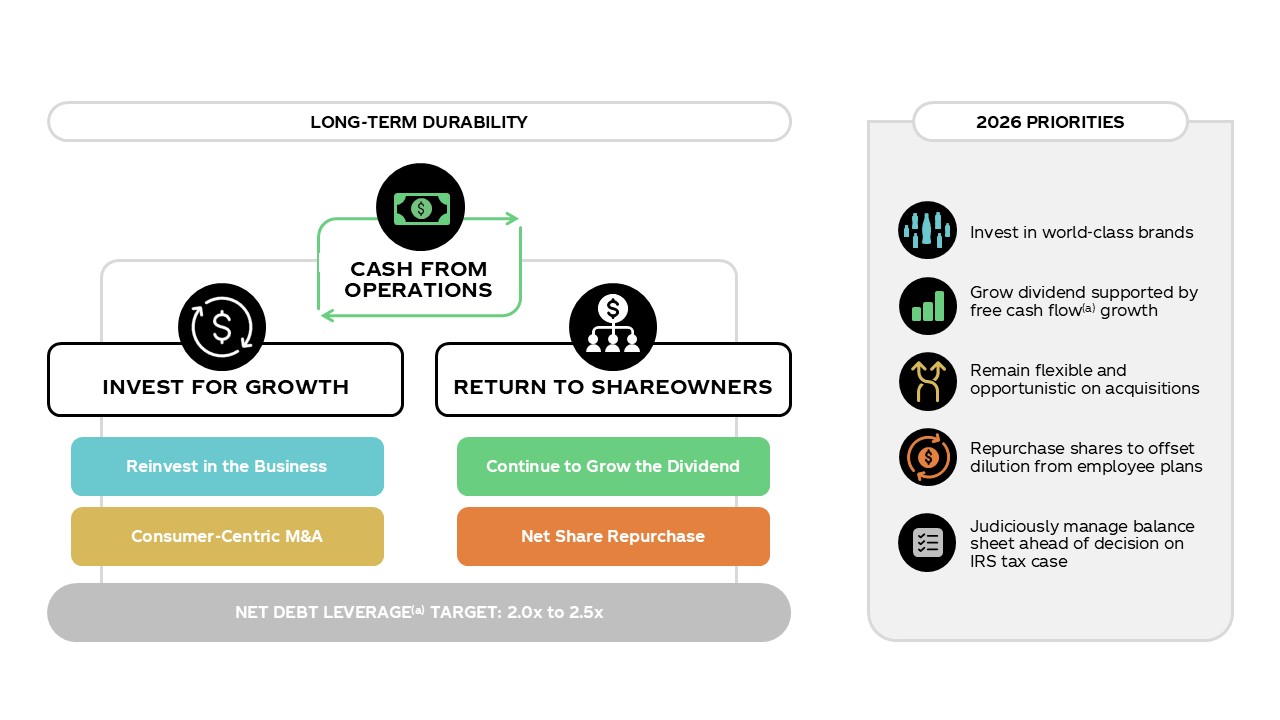
Achieving More Optionality on Our Capital Return Model
Our steadfast commitment to reinvesting back into our business and returning cash to shareowners is a defining characteristic of our capital allocation strategy. As we’ve stepped up our capital investments in recent years to support high-growth areas, we’ve simultaneously improved the return profile of our investments via an enhanced Return on Invested Capital. This has allowed us to maintain continued dividend growth, as we’ve increased our dividend for 64 consecutive years.
With respect to acquisitions and share repurchases, we'll stay both flexible and opportunistic. On acquisitions, while our track record has not been perfect, we have created value in aggregate. Just over half of our 32 billion-dollar brands were created inorganically. Most of these were bolt-on acquisitions that we later scaled ourselves. On share repurchases, we continue to repurchase shares to offset any dilution from the exercise of stock options by employees in the given year. Putting it all together, our capital allocation policy prioritizes both discipline and agility to drive the long-term health of our business and create value for our stakeholders.
Non-GAAP Reconciliations
Financial metrics referenced on this page are from The Coca-Cola Company's 2026 CAGNY Presentation. View the reconciliation of Non-GAAP Financial Measures linked below for more information.